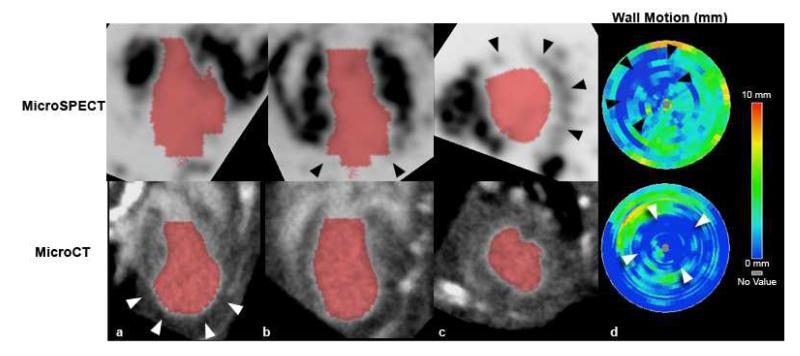
Figure 7.
(a-c) MicroSPECT (top) and microCT (bottom) images of the same mouse heart, acquired at approximately 14 days after left-anterior descending (LAD) coronary artery ligation procedure, with resultant myocardial infarction. The infarcted area is visible as a large anterolateral perfusion defect in the microSPECT images (black arrowheads in [b,c]), which is not evident in the microCT images. The microCT images do, however, show some apparent dilation of the apical portion of the left ventricle (white arrowheads in [a]). (d) Bullseye plots of LV regional wall motion for this mouse show distinct apical and LAD territory wall motion abnormalities (arrowheads) in both modalities, consistent with myocardial infarction. These areas of decreased wall motion correspond to the perfusion defect identified by microSPECT (black arrowheads), and the apical dilation seen by microCT (white arrowheads).

