Figure 1.

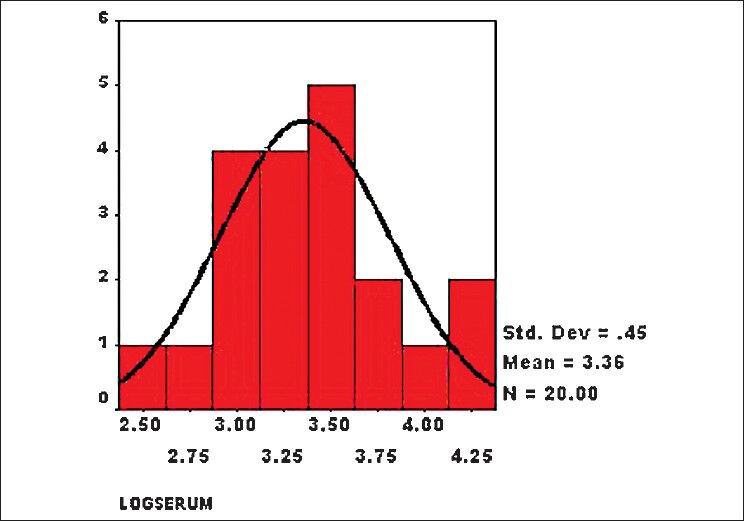
Histogram showing distribution of log values of serum homocysteine level in patients with retinal vein occlusion (cases) (n = 20, mean = 3.36, standard deviation = 0.45)

Histogram showing distribution of log values of serum homocysteine level in patients with retinal vein occlusion (cases) (n = 20, mean = 3.36, standard deviation = 0.45)