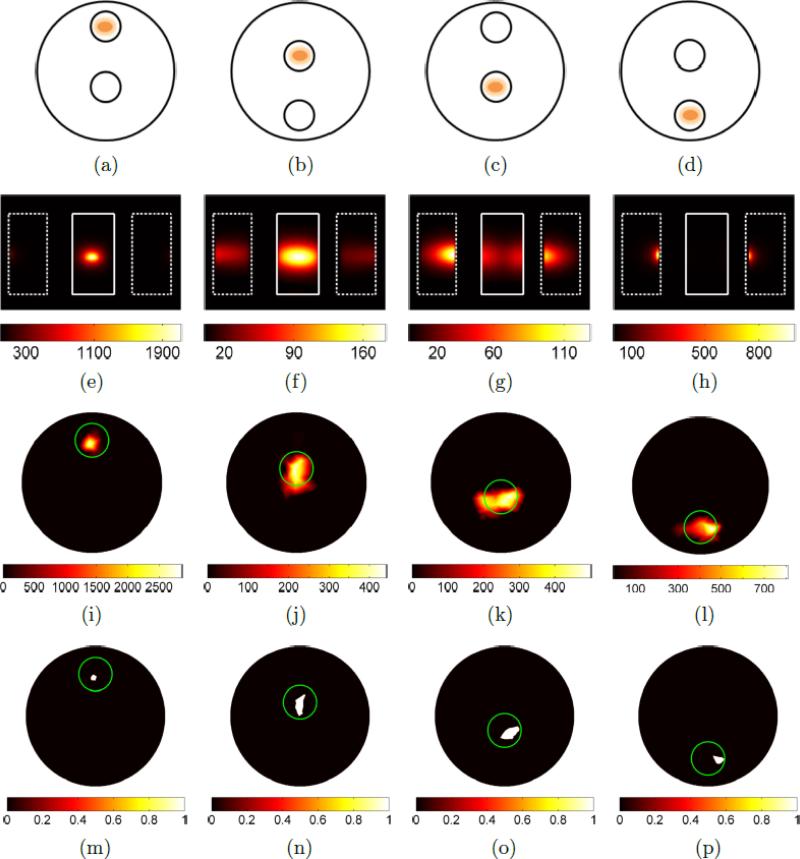
Figure 12.
Summary of on-axis, homogeneous BLT experiment results showing: (a-d) schematics of source experimental locations in 2D projection; (e-h) BLI images (CCD measurement e–/s) of the phantom at λ = 600nm with approximate phantom outlines; (i-l) slices through corresponding BLT reconstructions at the axial offset corresponding to the centre-of-mass of the reconstruction; and (m-p) the slice images thresholded at 75% of the maximum value.

