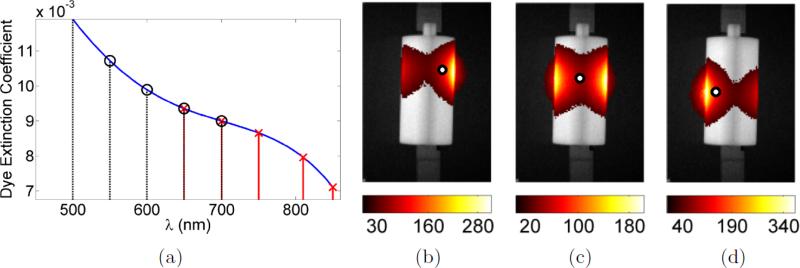
Figure 15.
(a) Spectral dye extinction coefficient. Spectral sampling is shown both in terms of where DOT data was acquired (red lines and crosses) and where the BLT data was acquired (black dashed lines and circles); (b-d) diffuse trans-illumination images at 750nm with NIR source positions 1, 15 and 36 repectively, visualised in the same manner as the BLI images in figures 9 and 10 with approximate source location (under the phantom) shown by the overlaid white circle.

