
Figure 1.
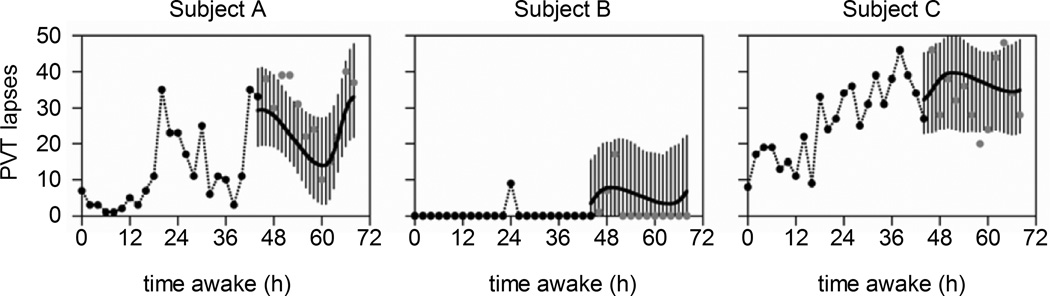
Simulation using the Bayesian forecasting procedure to predict future performance of three individuals, measured with the 10-minute PVT, during total sleep deprivation. Performance is predicted starting from t = 44h of wakefulness, with mean (black line) and 95% confidence intervals (vertical lines). Individual predictions are based on traits identified from prior performance measurements up to 44h (black dots). The gray circles show the actual performance measurements during the 24h prediction period. Figure reprinted with permission from Van Dongen and colleagues.53