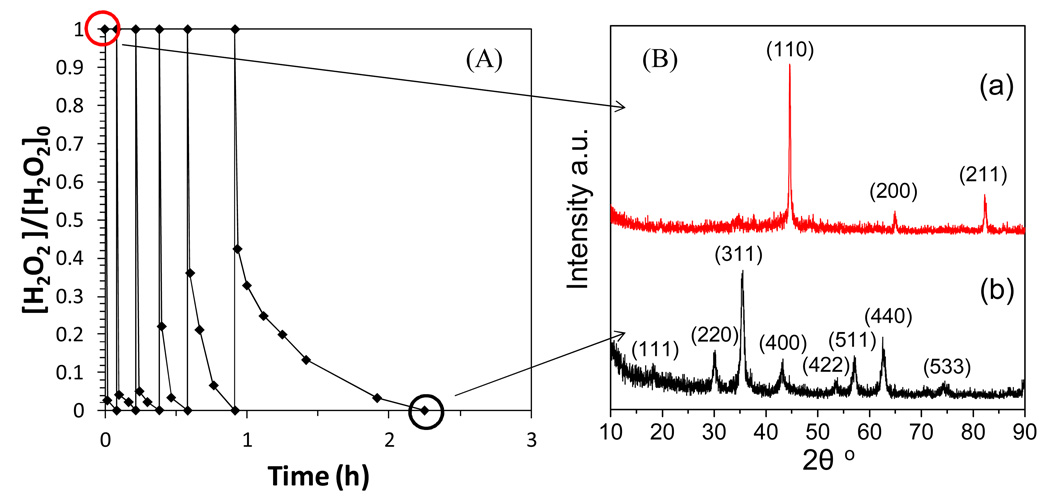
Figure 11.
H2O2 decomposition with Fe NPs (6 cycles). (A) H2O2 degradation; (B) iron transformation during the treatment. XRD spectra of Fe NPs before and after H2O2 treatment are shown in (a) and (b), respectively. [Fe]=20 mM, [H2O2] (each cycle)=4.4 mM, V=200 mL, pH=7.0–7.2. BET surface area (m2/g): 37.8 (Fe) and 53.0 (Fe3O4).

