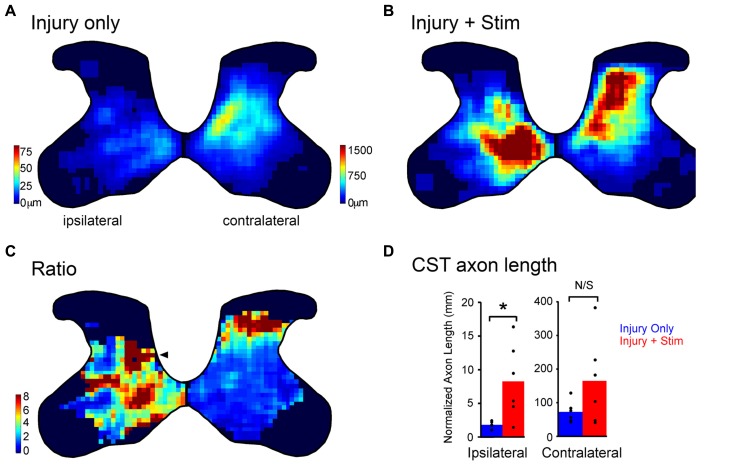
FIGURE 3.
Partial restoration of the normal axon distribution on the impaired side of the spinal cord. (A,B) Heatmaps of corticospinal tract axon length for rats with injury only (A) and combined injury and stimulation (B). Intensity scales in (A) also apply to (B). Note, the axon length scales are different on the two sides to show the full range on each side. (C) Stimulation induced outgrowth is shown as the pixel-by-pixel ratio of injury and stimulation rats to injury only rats expressed as fold-change. The arrowhead indicates a hot spot of stimulation-induced outgrowth on the ipsilateral side in the deep dorsal horn. (D) Quantification of corticospinal axon length for the contralateral and ipsilateral sides (*p < 0.05). (A–D) were modified from Carmel et al. (2013).

