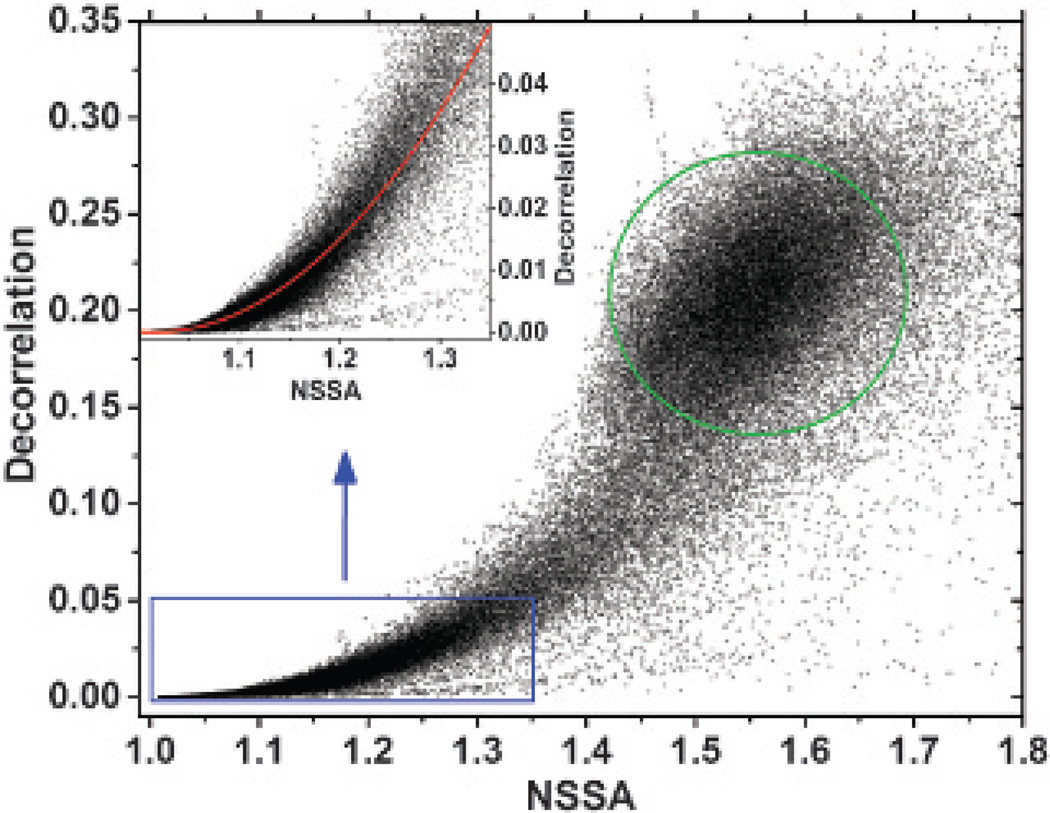
Figure 10.
Decorrelation versus NSSA of all source signals (ie, tissue, freely circulating microbubbles, and adherent microbubbles) from a dynamic NSSA signature experiment at 17 seconds with a flow rate of 40 mL/min (see Figure 8C). The inset shows the decorrelation-NSSA relationship within the typical range of adherent microbubbles and tissue. The red line is the quadratic fit with an adjusted R2 of .90 within the range of the inset. The green circle shows the typical range of freely circulating microbubbles.

