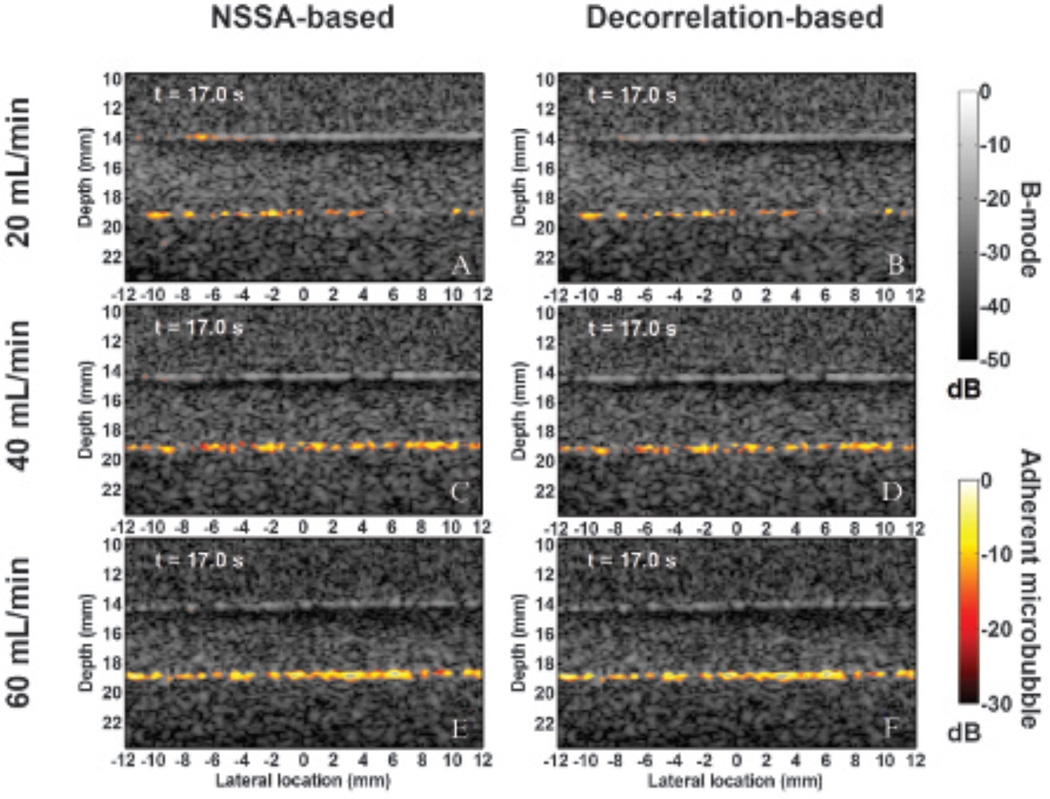
Figure 11.
Representative in vitro flow phantom images at 17 seconds after starting the beam sequence. Images were generated using NSSA-based SiSTM imaging at flow rates of (A) 20 mL/min (ie, 2.1 cm/s), (C) 40 mL/min (ie, 4.2 cm/s), and (E) 60 mL/min (ie, 6.3 cm/s). Corresponding decorrelation-based SiSTM imaging images are shown in (B) 20 mL/min (ie, 2.1 cm/s), (D) 40 mL/min (ie, 4.2 cm/s), and (F) 60 mL/min (ie, 6.3 cm/s). The “hot” color mapping is displayed on a 30 dB dynamic range after log compression to illustrate SiSTM-based adherent microbubble signal. The background B-mode images were formed from received acoustic echo data prior to NSSA/decorrelation-based filtering and are displayed on a 50 dB dynamic range after log compression.

