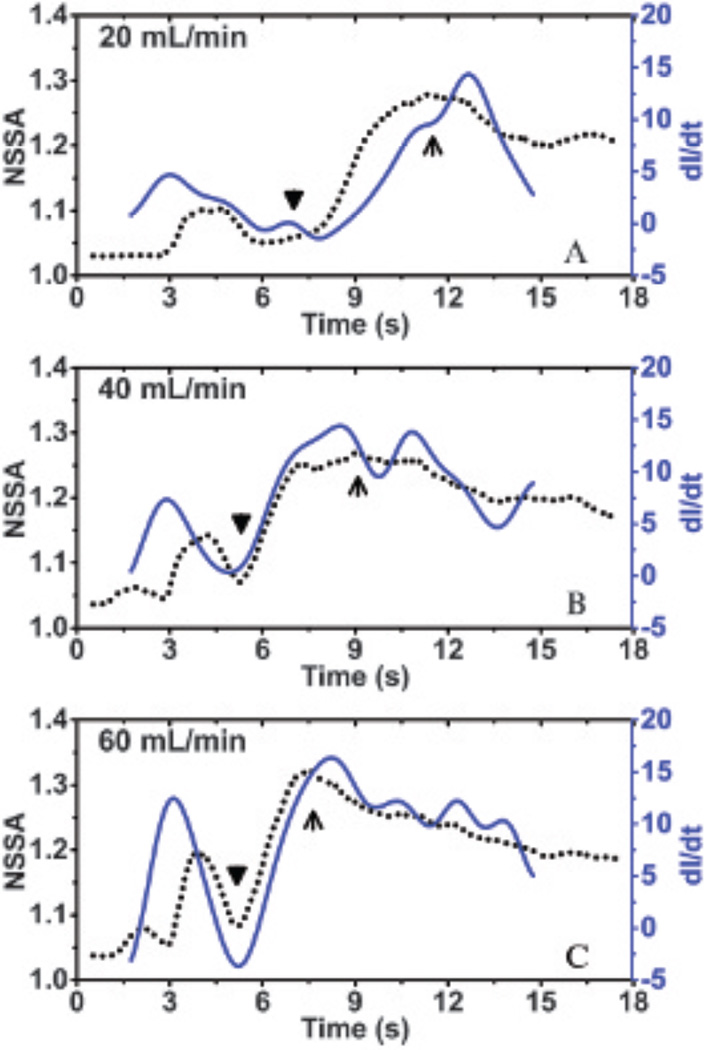
Figure 12.
Overlaid plots of dynamic NSSA curves and the time derivative of image intensity (dI/dt) in regions of adherent microbubbles at different flow rates: (A) 20 mL/min (ie, 2.1 cm/s), (B) 40 mL/min (ie, 4.2 cm/s), and (C) 60 mL/min (ie, 6.3 cm/s). Black triangles indicate the appearance of adherent microbubbles. Black arrows indicate the peaks of the NSSA curve. The minimum R2 value between dI/dt and NSSA within the increasing phase (ie, from triangle to arrow) of NSSA profile among three flow rates is .97. The results were averaged over 20 trials in different fluid channels.

