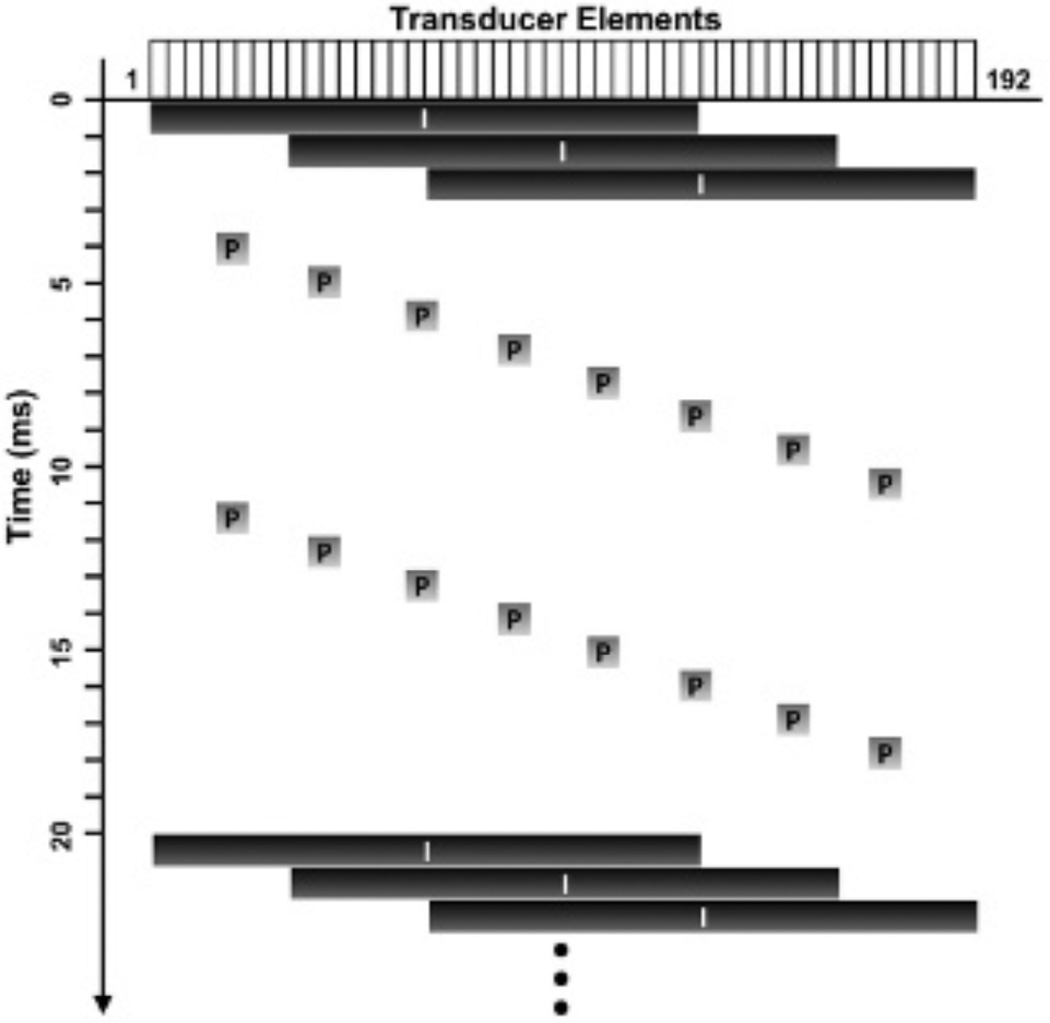
Figure 4.
A diagram of the custom beam sequences. The horizontal axis denotes corresponding elements (1 to 192), whereas the vertical axis represents time. Imaging and acoustic radiation force (pushing) pulses (represented with characters I and P, respectively) consisted of plane and focused waves, respectively. The width of the black boxes (I) represents the transducer elements used for plane wave transmit. The gray boxes (P) show the focal points of the corresponding focused pushing pulses.

