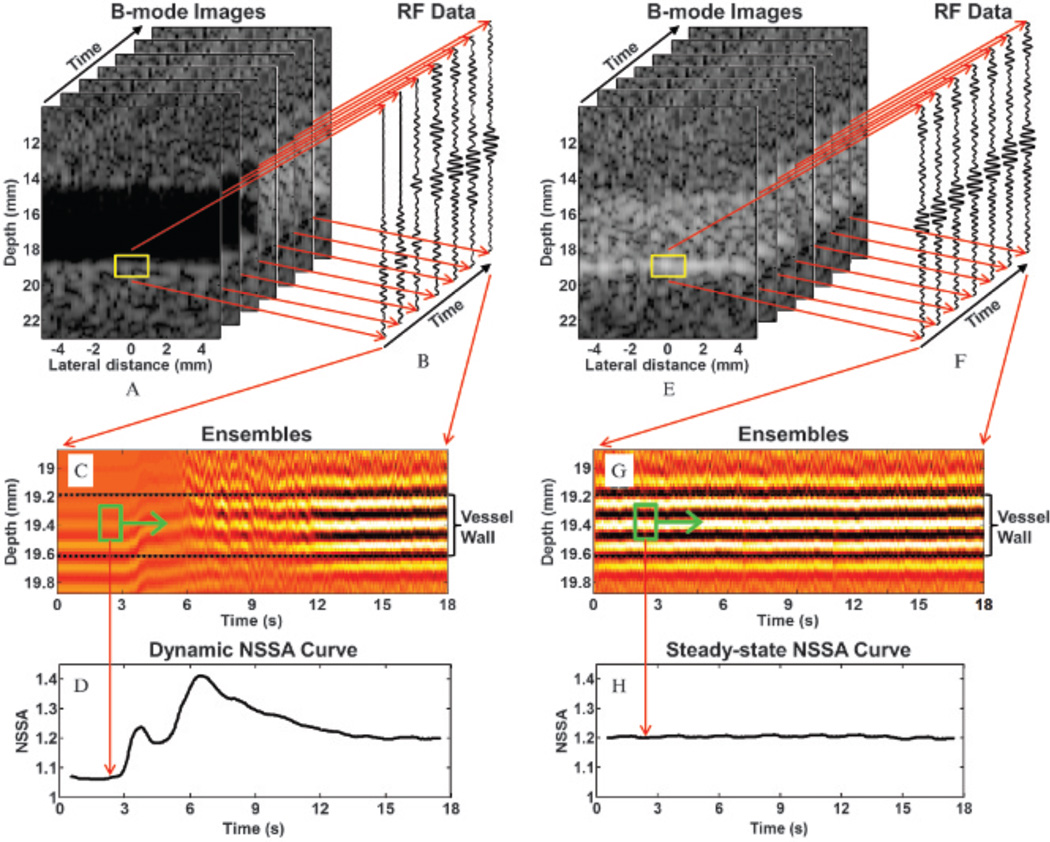
Figure 5.
A depiction of data processing methods used to obtain both dynamic and steady-state NSSA curves. A, A stack of 900 B-mode images from flowing fluid channel experiments with frame rates of 50 Hz. Yellow boxes (1 mm × 2 mm) show a zoomed-in region of the phantom vessel wall. B, Focused acoustic echo data (radiofrequency data) obtained through dynamic receive focusing method of raw acoustic echo data. Each A-line was averaged from 10 consecutive A-lines to decrease the effect of nonuniform distribution of microbubble concentration along the phantom vessel wall. C, Ensembles from the focused acoustic echo data within the yellow boxes in A. Green boxes (0.2 mm × 1 second) show the data used to calculate NSSA value and image intensity. D, Obtained dynamic NSSA curve. E to H are similar to A to D for steady-state NSSA curve.

