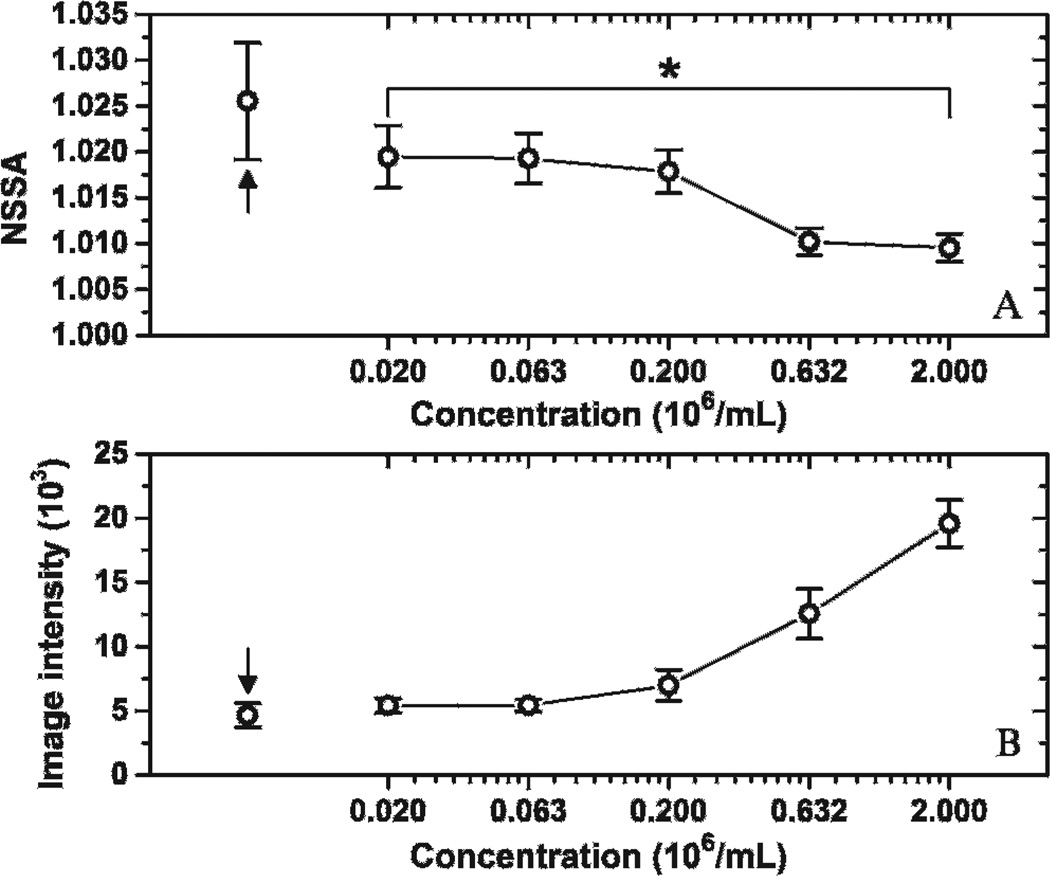
Figure 6.
Effects of microbubble concentration on NSSA value and image intensity of adherent microbubbles. *p < .018. Arrows indicate the control group with no microbubble injection. The results were averaged over five trials. Error bars show the standard deviation of the five trials in different fluid channels.

