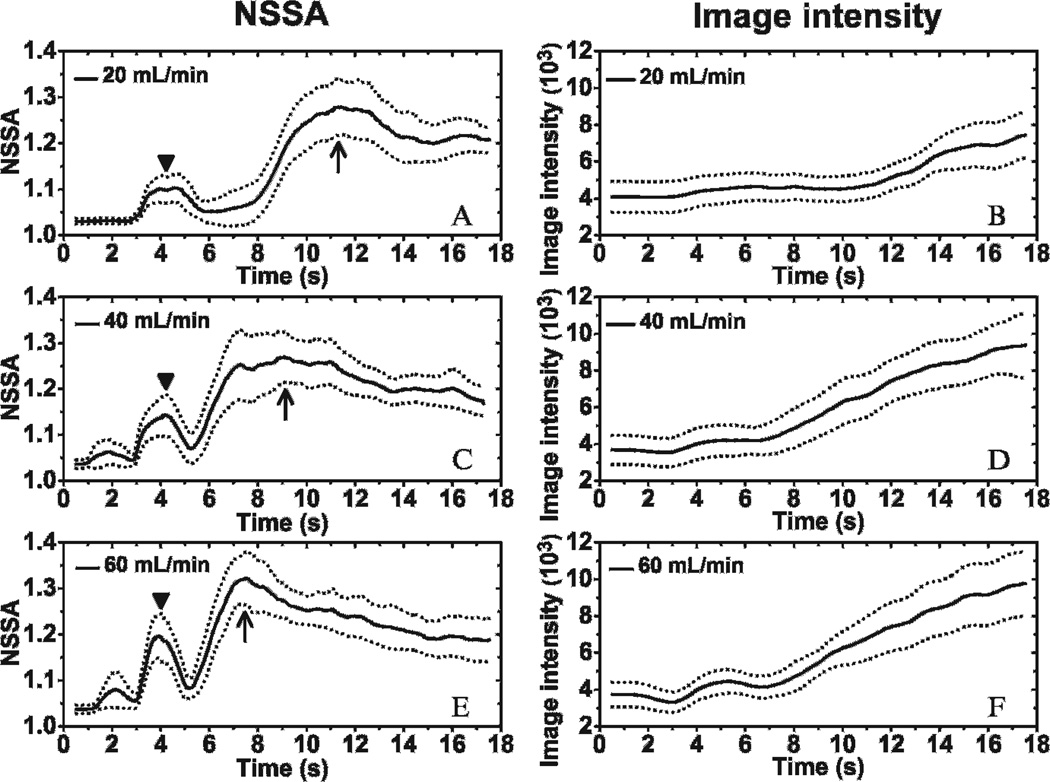
Figure 8.
Dynamic curves of NSSA and image intensity of adherent microbubbles with different flow rates. Mean (solid line) and standard deviation (dotted line) of NSSA at flow rates of (A) 20 mL/min (ie, 2.1 cm/s), (C) 40 mL/min (ie, 4.2 cm/s), and (E) 60 mL/min (ie, 6.3 cm/s). Mean (solid line) and standard deviation (dotted line) of image intensity at flow rates of (B) 20 mL/min (ie, 2.1 cm/s), (D) 40 mL/min (ie, 4.2 cm/s), and (F) 60 mL/min (ie, 6.3 cm/s). The syringe pump was started at 3 seconds to pull microbubble solution through the fluid channels. Triangles show the initial peaks in NSSA values caused by wall contraction. Arrows show the maximum peaks of NSSA curves. The microbubble concentration was 0.5 × 10⁶ mL−1. The results were averaged over 20 trials in different fluid channels.

