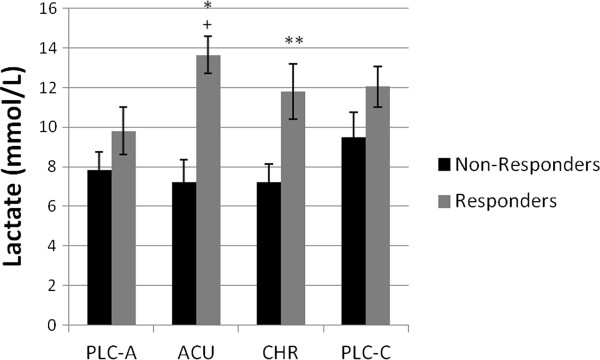
Figure 2.

Post-trial lactate concentrations (mmol/L) of responders and non-responders. aSignificantly different (P < 0.05) from acute placebo trial (PLC-A). bSignificantly different (P < 0.05) from non-responders in the acute (ACU) trial. cSignificantly different (P < 0.05) from non-responders in the chronic (CHR) trial. Values are Mean ± SEM.
