Figure 2.
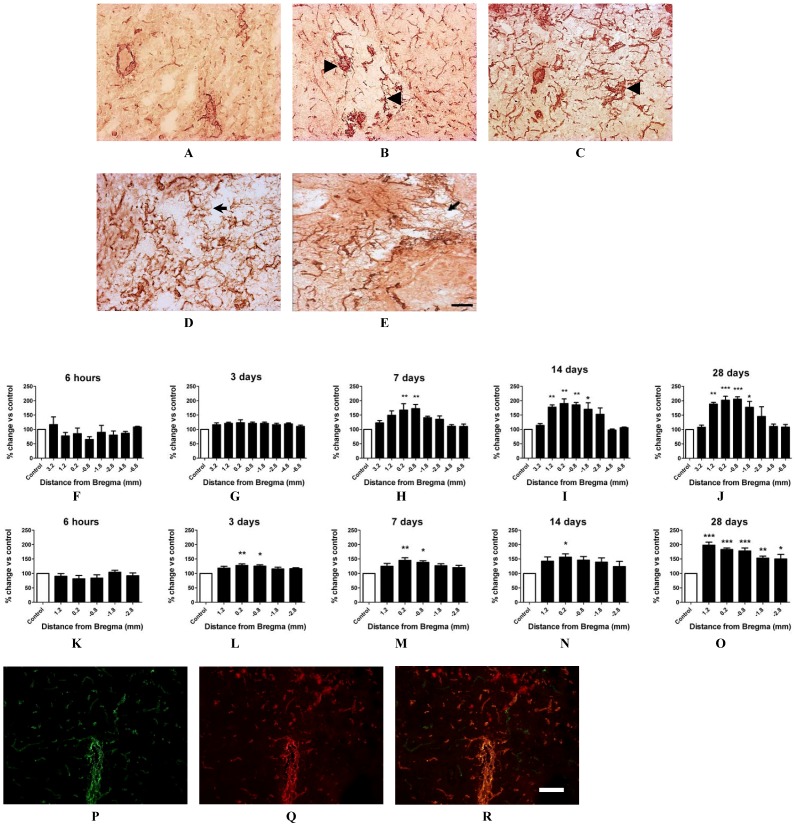
Angiogenesis in the ET-1 induced stroke affected brain. Immunohistochemical photomicrographs of vWF staining in the ipsilateral core cortex at 6 h, 3, 7, 14 and 28 days post-stroke (A–E respectively). Arrow heads indicate sprouting vessels and short arrows point to microvascular development by 14 and 28 days. Scale bar = 50 μM. Blood vessels were quantified in situ using vWF stained sections and point counted using Metamorph imaging software (F–O). A significant increase in the number of blood vessels was detected 7, 14 and 28 days after stroke in the ipsilateral core cortex (H–J respectively) and also at 3, 7, 14 and 28 days in the core ipsilateral striatum (L–O respectively) in comparison to respective contralateral mirror regions [6 h (n = 4); 3 days (n = 5); 7 days (n = 6); 14 days (n = 4); and 28 days recovery (n = 4)]. Data presented as mean ± S.E.M. * p < 0.05, ** p < 0.01, *** p < 0.001 compared with the contralateral side expressed as 100% control; one way ANOVA. Immunofluorescent photomicrographs of vWF (P) and lectin stain (Q). Merged images (R) show significant co-localisation of both vWF and lectin stain following lectin tail vein infusion indicative of vessel patency. Scale bar = 100 μm.

