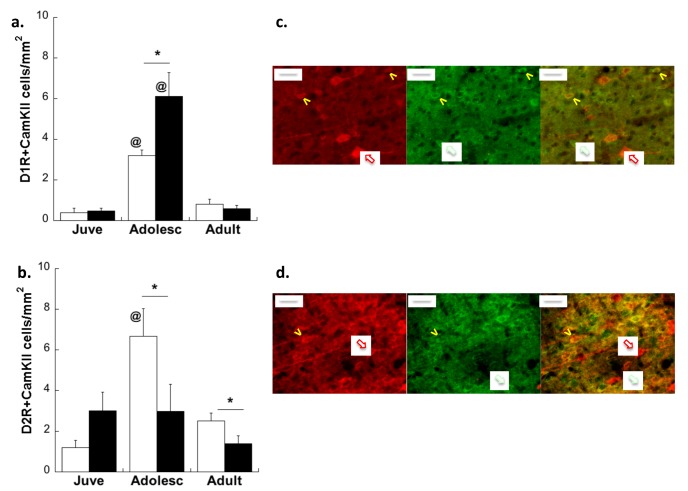
Figure 3.
D1R (a,c) and D2R (b,d) expression changes on CamKIIa-IR glutamatergic neurons after MS in the plPFC. * p < 0.05 difference between groups using Bonferroni post-hoc t-tests after 2-way ANOVA. @ p < 0.05 difference from juveniles. White bars: CON; Black bars: MS. Averages ± SEM are presented. n = 5–6. Representative photomicrographs of individual channels and overlays from control adolescents taken at 40× are shown in (c) and (d). Red-outlined white arrows point to CamKIIa neurons, green-outlined white arrows point to D1R (c) or D2R (d) neurons, and yellow pointers point to co-localized neurons. Scale bar: 20 µm.

