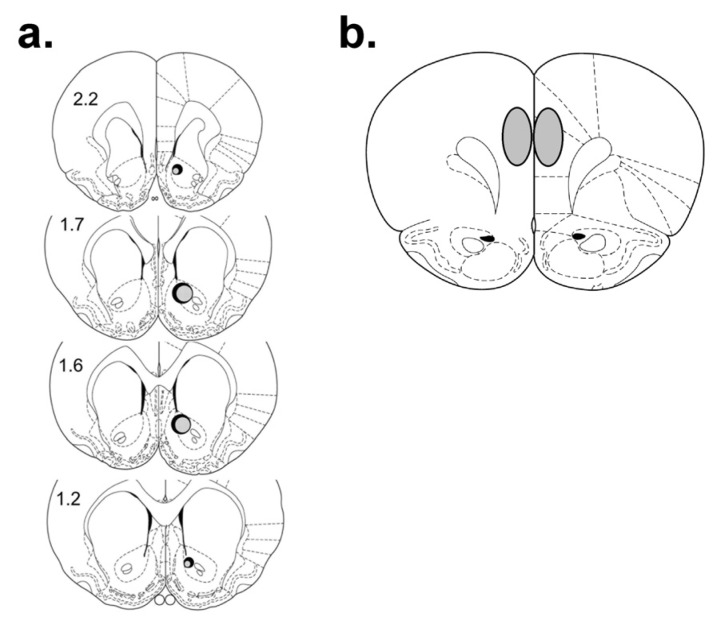
Figure 6.
Histological analysis of intra-NAc fluosphere injection sites (a) and the region of plPFC that comprised the largest density of retrogradely-traced neurons, and was therefore analyzed (b). Numerals indicate mm from bregma. The largest (solid) and smallest (shaded) bolus sizes of all animals included in analysis are indicated. All injection sites were within ±10% in size.

