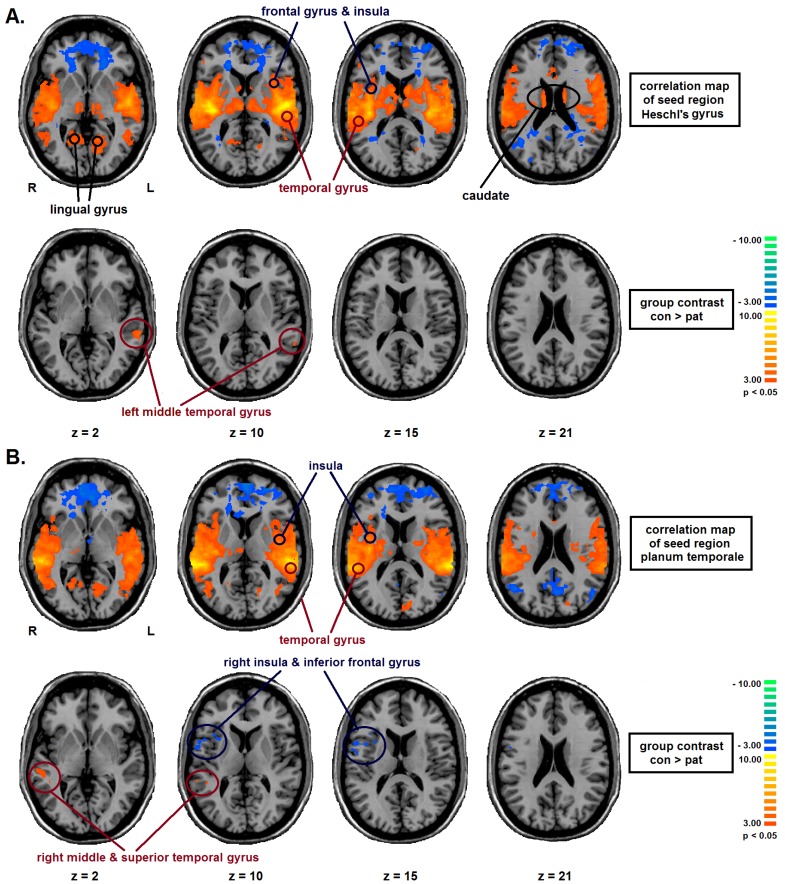
Figure 1.
One-way ANCOVA of the functional connectivity scores (FC) with Group as between-subject factor and age, sex and education as covariates (ANCOVA F-map corrected for FDR and cluster size) and T-Tests of the group contrast controls (n = 20) vs. bipolar disorder (BD) patients (n = 21), cluster threshold: p < 0.05). The upper rows indicate the functional connectivity maps in the entire sample, the lower rows the group contrast. (A): Significant regions with bilateral Heschl’s Gyrus (HG) as seed-region. Colour code: red = positive FC. blue = negative FC. (B): Significant regions with bilateral planum temporale (PT) as seed-region. The left side in the figure indicates the right side of the brain (radiological convention). Colour code: red = CON > PAT. blue = PAT > CON.

