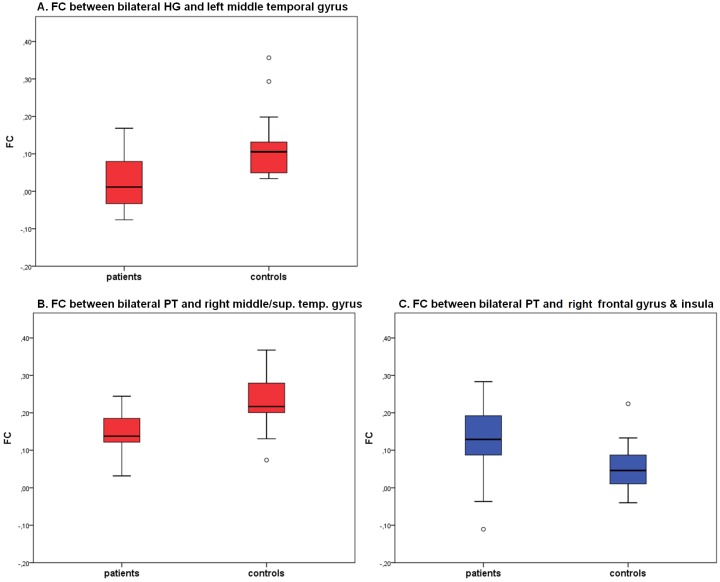
Figure 2.
Coefficients of functional connectivity (FC) of significant areas in the group comparisons of the seed-regions for BD patients (n = 21) and controls (n = 20). Upper rows (A): FC between bilateral Heschl’s Gyrus (HG) and left middle temporal gyrus. Lower rows (B, C): FC between bilateral planum temporale (PT) and right middle and superior and middle temporal gyrus and between bilateral PT and the right inferior frontal and precentral gyrus and right insula. red = patients < controls, blue = patients > controls. Vertical lines indicate the upper and lower quartiles, single points display outliners.

