Figure 5.
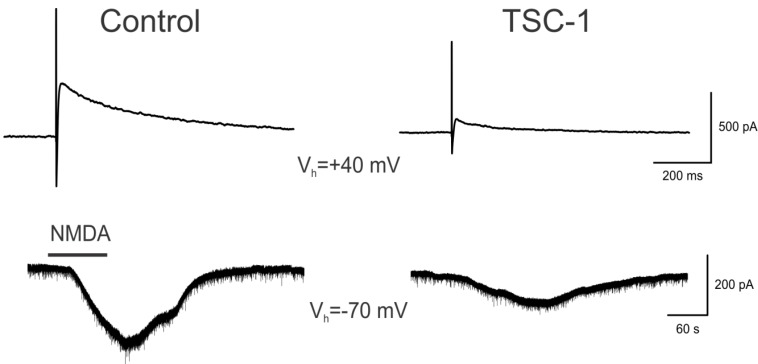
Neuroprotection of Medium-sized Spiny Neurons (MSNs). Upper traces represent responses of striatal MSNs evoked by electrical stimulation (0.2 mA, 0.1 ms duration) of cortical inputs. Recordings were obtained with patch electrodes in voltage clamp mode (holding voltage at +40 mV). Control trace is a NMDA receptor-mediated response recorded in normal ACSF solution and isolated pharmacologically by adding 2,3-dihydroxy-6-nitro-7-sulfamoyl-benzo[f]quinoxaline-2,3-dione (NBQX, 10 μM) and Bicuculline (10 μM). The trace on the right is from another cell recorded after the slice was incubated for 1 h in TSC1 solution (2 μL/mL). Lower traces show responses to bath application of NMDA (100 μM) in ACSF (left) or after incubation for 1 h in TSC-1. Notice that the NMDA responses were significantly reduced compared to control conditions. Calibration bars apply to both traces.

