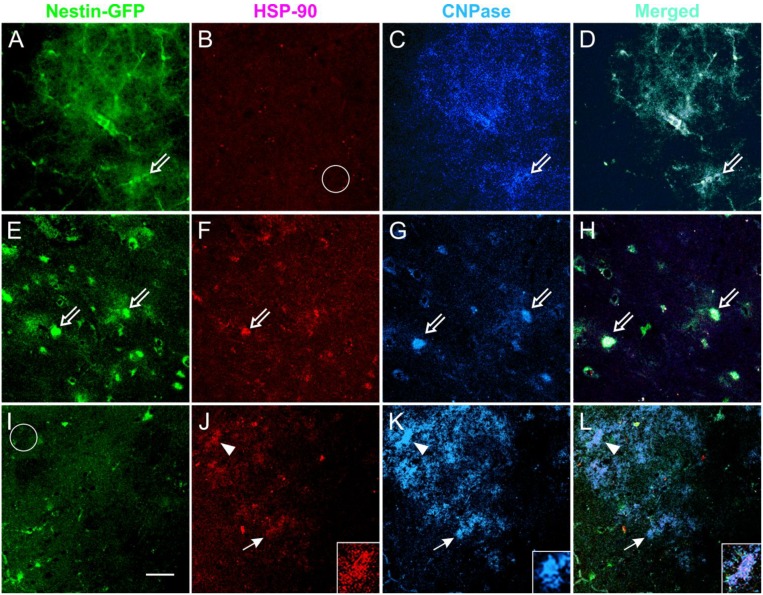
Figure 7.
Acute NMDA elicits the expression of HSP-90 in the CPu and TSC1 neutralizes the NMDA effect. Views of the CPu of 300 μm coronal slices used for the acute treatment of NMDA alone or in slices pre-incubated with TSC1. After electrophysiology, slices were fixed and immunolabeled for the cell stress marker HSP-90 and the OL marker CNPase. HSP-90 was expressed in some cells located in the CPu white matter. Non-treated slices (A–D) displayed nestin-expressing cells that were negative for HSP-90 (B–empty circle). Slices directly exposed to NMDA (E–H); showed colocalization of nestin and HSP-90 (E,F) and few cells co-express the three markers (open arrows). CNP-expressing cells lost processes or expression of CNPase in their processes. Slices incubated with TSC1 prior to NMDA. TSC1 appeared to maintain the tissue in a mild stage of stress with fewer nestin-expressing cells co-expressing HSP-90 (panel I) and increased number of CNPase-positive OL (K). Arrowheads show cells co-expressing HSP-90 and CNPase (K). Insets show detail of the label distribution of the cell marked with arrowheads, the merged view allows for the visualization of HSP-90 in the cell soma while CNPase is distributed in the cell body and numerous cell processes (L). K-inset shows a healthy OL that did not express HSP-90 (I-circle).

