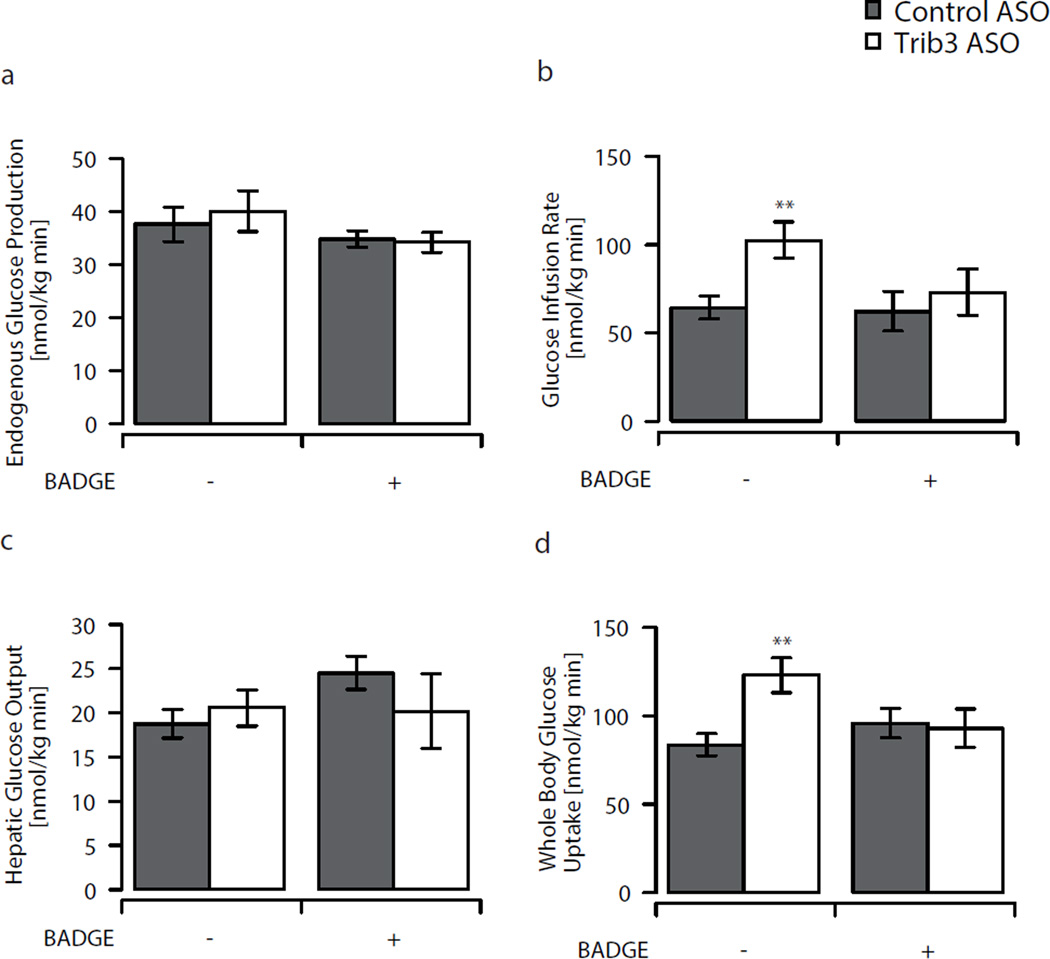
Fig. 2.
Glucose turnover assessed by euglycaemic–hyperinsulinaemic clamps. a Endogenous glucose production, (b) glucose infusion rate, (c) insulin-stimulated hepatic glucose output and (d) whole-body glucose turnover in Trib3 ASO treated (white bars; control ASO, grey bars) animals with and without additional BADGE treatment. Values are given as mean±SE, n=12 per group, n=6–8 per group for BADGE treated animals. **p<0.01

