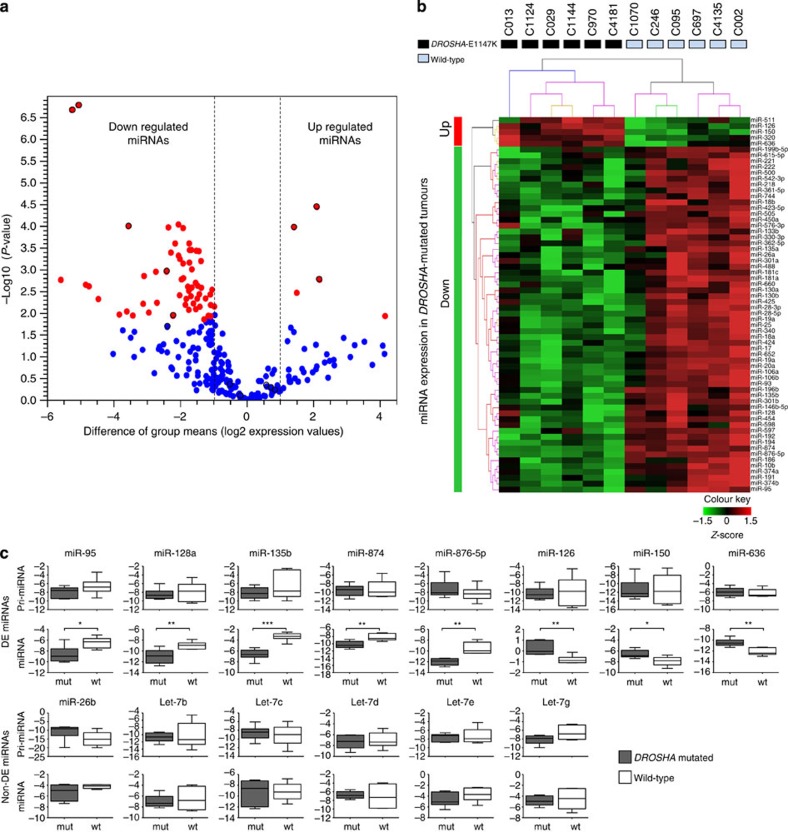
Figure 3. Comparison of miRNA expression levels of six DROSHA-E1147K-mutated and six wild-type WT samples.
The samples used in this analysis were fresh-frozen tumours from COG from patients that were not subjected to neoadjuvant chemotherapy. Panels a and b refer to the TaqMan Array miRNA profiling experiment. Panel c refers to the individual TaqMan assays. (a) Volcano plot showing a predominant reduction in mature miRNAs in DROSHA-E1147K tumours. The x axis represents the difference of group means (log2 expression values) of DROSHA-mutated and wild-type tumours; the y axis represents the statistical significance (−log10 P-values). Each miRNA is represented by a dot, and red dots represent those miRNAs that were differentially expressed between the groups; red dots with black borders were selected for pri-miRNA/mature miRNA validation (Fig. 3c). A total of 64 out of 249 miRNAs were differentially expressed between mutated and non-mutated samples. Downregulated miRNAs were over-represented, as 59 miRNAs were downregulated and only 5 were upregulated (Supplementary Table 8). (b) Unsupervised hierarchical clustering analysis based on expression data for the 64 differentially expressed miRNAs confidently discriminated DROSHA-E1147K from non-mutated samples. (c) Primary and mature miRNA expression. The expression of primary and mature miRNA pairs of eight differentially expressed (DE) and six non-differentially expressed controls (non-DE) was assessed by TaqMan individual assays of the same 12 samples from the array platform. Mean values and s.d. of experiments are shown; statistical significance was calculated using the t-test (*P≤0.01; **P≤0.001; ***P≤0.0001). While all eight DE mature miRNAs were validated as differentially expressed between the DROSHA-mutated and wild-type groups (bottom diagrams), none of the eight DE pri-miRNAs exhibited any significant difference in expression (top diagrams). For the six control miRNAs, no difference in expression level was observed in both mature and pri-miRNAs between the groups (fold changes and P-values are presented in Supplementary Table 9). These results confirm that the differences in mature miRNA expression levels resulted from impaired Drosha activity.

