
Figure 3.
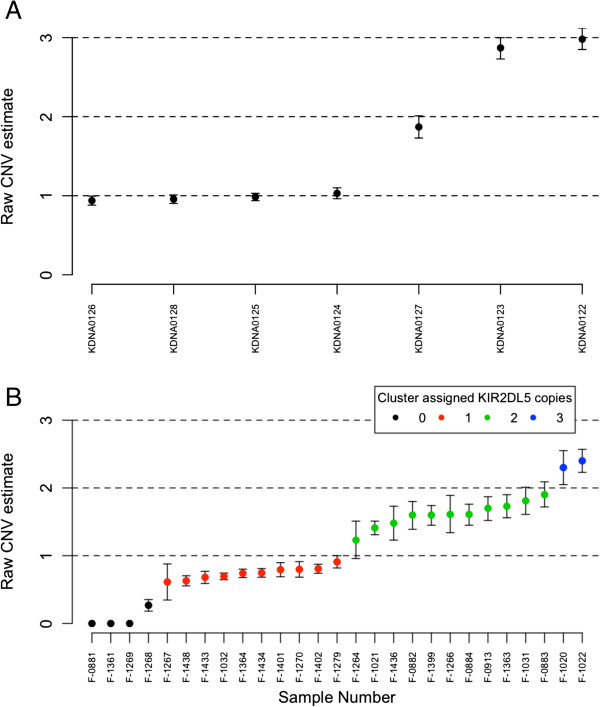
KIR CNV estimates in (A) UCLA International KIR exchange samples and (B) Gambian family samples. Colour-coded points indicate cluster membership (0 copies (n = 3), 1 copy (n = 10), 2 copies (n = 12), 3 copies (n = 2)).
Official websites use .gov
A
.gov website belongs to an official
government organization in the United States.
Secure .gov websites use HTTPS
A lock (
) or https:// means you've safely
connected to the .gov website. Share sensitive
information only on official, secure websites.
KIR CNV estimates in (A) UCLA International KIR exchange samples and (B) Gambian family samples. Colour-coded points indicate cluster membership (0 copies (n = 3), 1 copy (n = 10), 2 copies (n = 12), 3 copies (n = 2)).