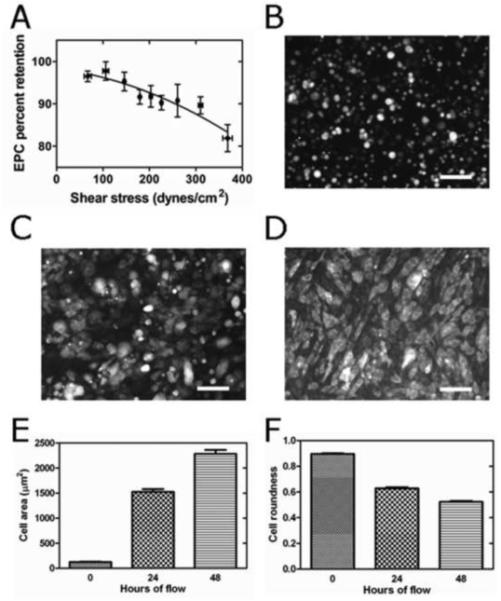
Fig. 4.

(a) % EPC retention under 68 different (increasing) shear stresses after 15 min settling time on Ti followed by 5 min flow. Results grouped into 9 clusters. For each shear stress, 5 images at 100 x magnification with approximately 100 cells per image were evaluated. EPCs were derived from 3 different pigs. Error bars indicate ± 1 SEM. (b) EPCs on Ti at initiation of flow, (c) 24 hrs, and (d) 48 hrs after initiation of flow at 15 dynes/cm2. Area (e) and roundness (f) of EPCs on Ti after 0 hr, 24 hrs and 48 hrs of flow at 15 dynes/cm2. Error bars indicate ± 1 SEM for E,F.
