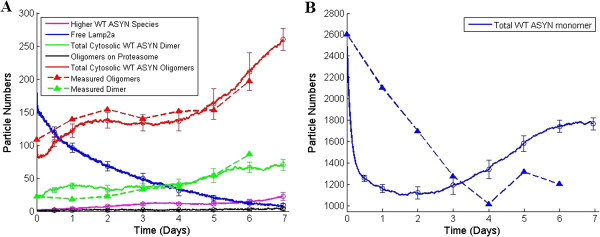
Figure 7.

Average output curves of ten stochastic simulations of the model for the WT over-expression system. (A) Total amount of ASYN oligomeric (red) and dimeric species (green) are very similar when compared to quantitative experimental data (dashed lines). Levels of Lamp2a, HMW species, oligomers in proteasome also match the available qualitative knowledge. (B) Although simulation output for WT ASYN monomers did not accurately reproduce the experimental data, it did give a good indication of the observed phenomena regarding the trends: initial drop followed by a weak recovery.
