Figure 8.

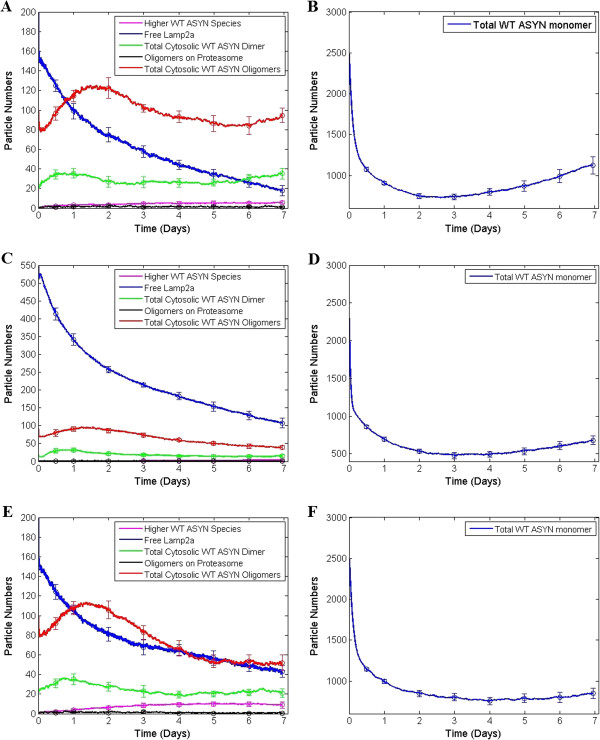
Model predictions for three hypothetical scenarios for which no information was fed into the model during calibration. In the first scenario the expression rate of ASYN was reduced by 50%, (A) levels of dimers (green) and oligomers (red) seem to return to their initial values after day 5 and free Lamp2a (blue) remains at higher levels at day 7 compared to Figure 7A. (B) This slightly increased concentration of Lamp2a has the opposite effect to the levels of WT ASYN monomers. (C) In a second hypothetical scenario, we tripled the initial amount of Lamp2a and ASYN oligomers and dimers appear in lower levels at day 7 than their initial amounts. Free Lamp2a on the other hand is increased. (D) WT alpha-synuclein monomers remain at lower levels for the last few days compared to those in the previous scenario. (E) In the third hypothetical scenario DA production was set to zero and at the end of the simulation levels of oligomers are reduced compared with their initial condition. Dimers return to their initial levels at day 7 while Lamp2a levels do not approach zero. (F) Levels of monomeric ASYN manifest a slower recovery trend compared to the other two scenarios.
