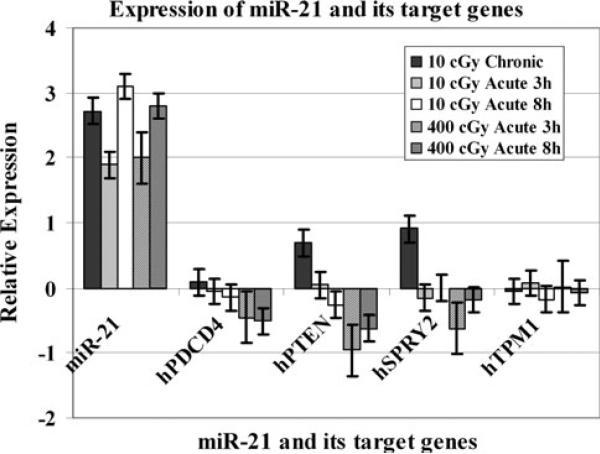
Fig. 6.
mRNA expression analyses of the miR-21 target genes, hPDCD4, hPTEN and hSPRY2 in 10 or 400 cGy irradiated AG1522 cells. The expression pattern of miR-21 is included for comparison. The data are plotted as Log2 values and indicate relative mRNA expression measured at 10 min, 3 h, and 8 h time points after radiation treatment. The error bars indicate the standard error of the mean (SEM) for three independent experiments

