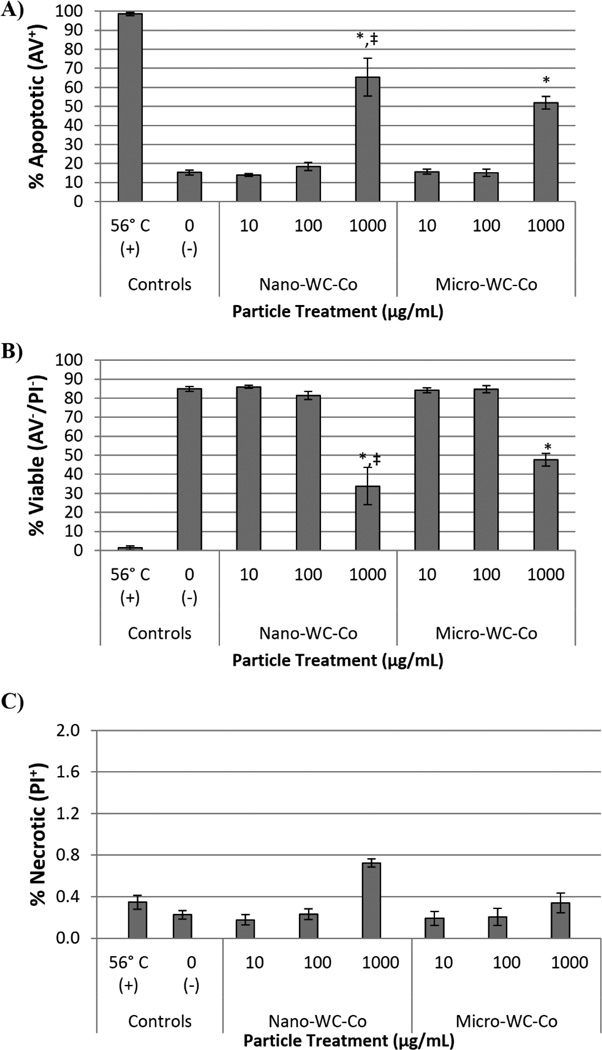
Figure 3.
Summary of flow cytometry staining profiles after 12 hr WC-Co particle exposure: A) total percentage of apoptotic cells (AV+/PI+ and AV+/PI−; sum total of upper and lower right quadrants), B) total percentage of viable cells (AV−/PI−; lower left quadrant) and C) total percentage of necrotic cells (PI+/AV−; upper left quadrant) (*P < 0.05 compared to control, ‡P < 0.05 compared to micro-WC-Co)

