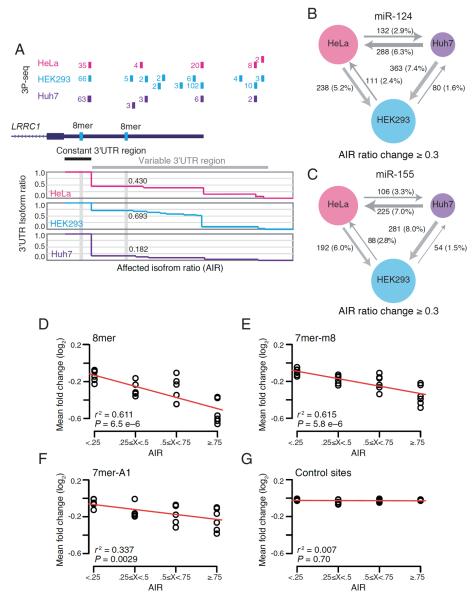
Figure 2. The 3'UTR landscape affects miRNA targeting.
(A) Different AIRs for miR-124 sites the LRCC1 gene in different cell types. Shown is the RefSeq annotation track of LRCC1 (dark blue), with the associated 3P tags from the three cell lines assayed (above) and the corresponding AIRs (below).
(B, C) Extent to which APA affects miRNA site inclusion. Shown are the number and percentage of sites for which AIRs for miR-124 (B) or miR-155 (C) change by at least 0.3 in each pairwise cell-type comparison. The arrows point to the cell line with the higher AIR, and the width is proportional to the number of sites with differential AIR.
(D–G) Relationship between AIR and miRNA-mediated repression. For each site type [8mer (D), 7mer-m8 (E), 7mer-A1 (F) and a representative pair of control sites (G)], predicted targets were binned by their AIR. For each bin, the mean fold-change mediated by either miR-124 or miR-155 for each transfection of the various cell lines (HEK293, HeLa and Huh7) is plotted. The red line is the least-squares best fit to the data (Pearson r2, F-test)..

