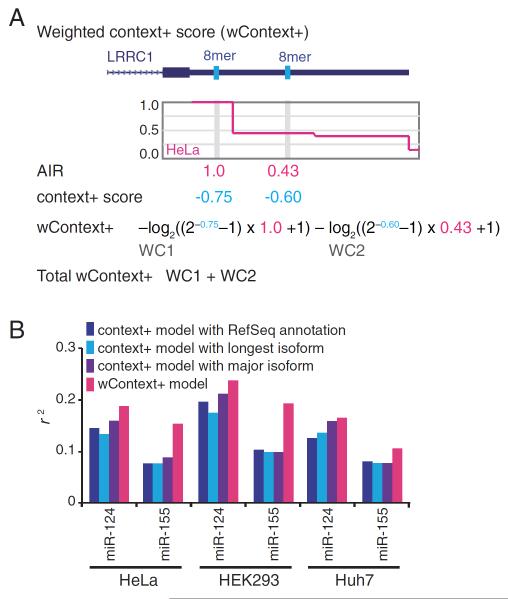
Figure 3. The weighted context+ model improves target prediction.
(A) Calculation of wContext+ scores. For each site, the context+ score, calculated using the TargetScan linear regression model, is weighted by a cell-type–specific AIR. For genes with multiple sites, the scores for each individual site are added to yield the total wContext+ score.
(B) Improved performance of the wContext+ model. Plotted are r2 values calculated from the correlation (Pearson r) between score and observed change in the indicated transfection dataset. For the previous model (context+), three different 3'UTR annotations were used: the RefSeq annotation (dark blue); the longest isoform, as determined by 3P-seq (light blue); the major isoform, as determined by 3P-seq (purple).

