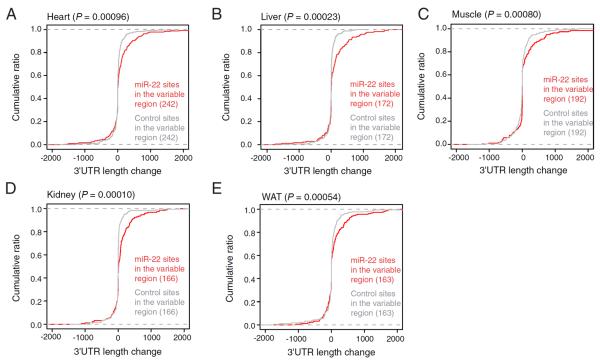
Figure 7. Repression by miR-22 shapes the 3'UTR landscape.
(A–E) Influence of miR-22 targeting on 3'UTR isoform usage. Weighted 3'UTR lengths were determined using 3P-seq data from heart (A), liver (B), muscle (C), kidney (D) and WAT (E). Plotted are the cumulative distributions of the differences in lengths (subtracting that of the wild-type tissue from that of the miR-22Δ tissue) for genes with control sites in the variable region (grey) and those with miR-22 sites in the variable region (red). Significance was determined using the Kolmogorov-Smirnov test.

