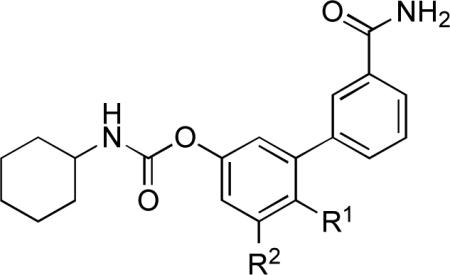
Table 2.
Inhibitory Potency (IC50) and Systemic Distribution of 5-(or 6-)Substituted 3’-carbamoyl-O-biphenyl-3-yl Carbamates.

| ||||||
|---|---|---|---|---|---|---|
| R1 | R2 | In vitro IC50 (nM)a | FAAH inhibition in liver (%)b | FAAH inhibition in brain (%)b | PSA (Å2)d | |
| 3 | OH | H | 2.0 | 91.7±0.7 | −3.0±8.0 | 83 |
| 15 | OCH3 | H | 0.5 | 94.6±0.7 | 86.4±2.1 | 74 |
| 21 | CH2OH | H | 1.2 | 91.5±1.1 | 10.5±1.5 | 83 |
| 29 | COOH | H | 2100 | 86.3±1.3 | −2.1±0.5 | 94 |
| 30 c | OSO3NH4 | H | 34 | 84.0±1.2 | −11.7±2.6 | 117 |
| 35 | H | OH | 0.5 | 89.5±1.1 | −4.2±2.5 | 84 |
| 41 | H | OCH3 | 2.0 | 85.6±2.4 | 82.6±0.4 | 74 |
IC50 measured in membrane preparations of Wistar rat brain
FAAH inhibition measured ex vivo 1 h after injection in Swiss Webster mice (1 mg/kg, intraperitoneal, n = 3)
30 was obtained from 3 upon treatment with SO3-DMF complex in dry DCM (see experimental section for further details)
PSA values were calculated using ICM version 3.7 (Molsoft LLC, San Diego, CA).
