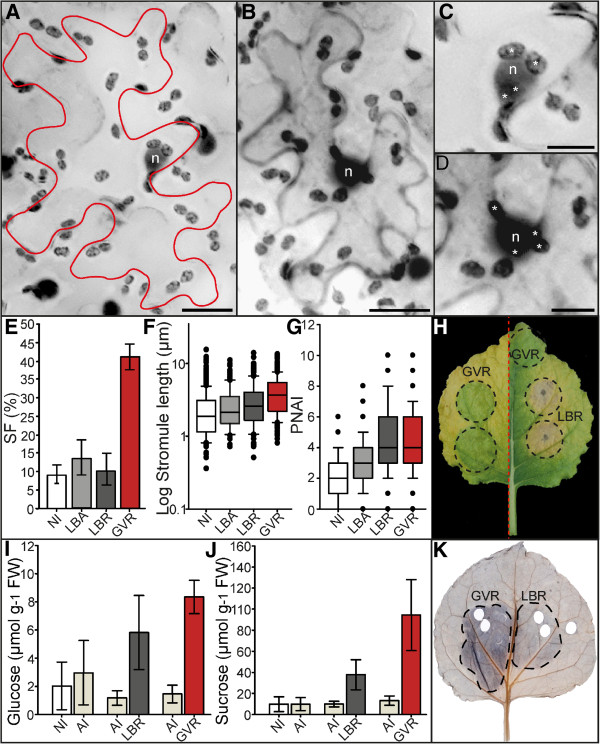
Figure 2.

Infiltration with LBA and LBR induces mild alterations to plastid morphology and position relative to GVR infiltrated cells. ‘Stacked’ fluorescence images of Nicotiana benthemiana lower epidermis with FNR-EGFP labeled plastids. In non-infiltrated and LBA-infiltrated treatments nuclei were stained via DAPI, while nuclei of LBR and GVR treatments were labeled via nucleoplasmic DsRed2. Epidermal plastids are dark grey, nuclei labeled ‘n’. Images were converted to gray scale and inverted for easier viewing of stromules. Images were taken 3 days post-infiltration. Scale=20 μm (A, B), or 10 μm (C, D). A Infiltrated with LBA. Cell boundary marked in red. B Infiltrated with LBR. Cell boundary marked by cytosolic DsRed2. C, D Enlargements of nuclei in A and B respectively, showing plastids in close proximity to the nucleus (indicated by asterisks ‘*’). E Bar graph of mean stromule frequency (SF) in non-infiltrated (NI), LBA-infiltrated (LBA), LBR-infiltrated (LBR), and GVR-infiltrated (GVR) tissues. Rank sum (NI-LBA): U=48, p=0.131; (NI-LBR): U=73, p=0.872; (LBA-LBR): U=28, p=0.289); (GVR-NI, LBA and LBR): U=0, p<0.001. Sample sizes: n(NI)=17, n(LBA)=9, n(LBR)=9, and n(GVR)=18. Raw data were arcsine transformed and bars represent back-transformed means. Error bars represent back-transformed 95% confidence intervals. F Box plot illustrating median stromule lengths in non-infiltrated (NI), LBA-infiltrated (LBA), LBR-infiltrated (LBR), and GVR-infiltrated (GVR) tissues. Rank sum (NI-LBA): U=34726, p=0.005; (NI-LBR): U=25226.5, p<0.001; (LBA-LBR): U=11983.5, p=0.053; (NI-GVR): U=95386.5, p<0.001; (LBA-GVR): U=46698, p<0.001; (LBR-GVR): U=45923, p<0.001. Sample sizes: n(NI)=448, n(LBA)=181, n(LBR)=151, and n(GVR)=805. G Box plot illustrating median plastid nuclear association index (PNAI) in non-infiltrated (NI), LBA-infiltrated (LBA), LBR-infiltrated (LBR), and GVR-infiltrated (GVR) treatments. Rank sum (NI-LBA): U=8772, p<0.001; (LBA-LBR): U=3380.5, p<0.001; (LBR-NI): U=2384, p<0.001; (GVR-NI): U=7738, p<0.001; (GVR-LBA): U=10906, p<0.001); (LBR-GVR): U=9450.5, p=0.359. Sample sizes: n(NI)=182, n(LBA)=147, n(LBR)=83, and n(GVR)=244. F, G Boxes contain 50% of data, the median is represented by black line. Error bars represent 90% confidence intervals. H Two senescing leaves (divided by a red dotted line) showing the maintenance of ‘green islands’ in GVR-infiltrated regions, and premature senescence of LBR-infiltrated regions. Infiltration zones outlined with black dotted lines. I Mean absolute glucose content of non-infiltrated (NI), AIM-infiltrated (AI), LBR-infiltrated (LBR) and GVR-infiltrated (GVR) tissues. Rank sum (NI-AI): U=14, p=0.209; (AI-LBR): U=0, p<0.001, t-test (AIM-GVR): t=13.577, p<0.001; (LBR-GVR): t=2.323, p=0.039. Sample sizes: n(NI, AI, LBR, GVR)=7. Error bars represent standard deviations. J Mean absolute sucrose content of non-infiltrated (NI), AIM-infiltrated (AI), LBR-infiltrated (LBR) and GVR-infiltrated (GVR) tissues. Rank sum (NI-AI): U=24, p=1, t-test (AIM-LBR): t=5.082, p<0.001, Rank sum (AIM-GVR): U=0, p<0.001), t-test (LBR-GVR): t=4.098, p=0.001). Sample sizes: n(NI, AI, LBR, GVR)=7. Error bars represent standard deviations. K Starch staining of a leaf infiltrated with GVR and LBR 3 days post-infiltration. Infiltration zones outlined with black dotted lines.
