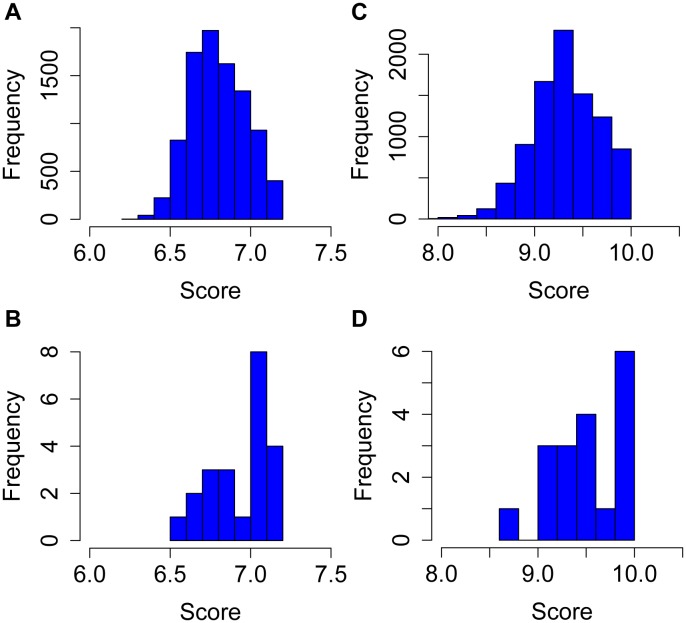
Figure 3. Search for single XYR1 and CRE1 binding sites on different promoter datasets.
For the analysis, only the best site was retrieved for each studied promoter. A) Distribution of XYR1-binding sites score for all genes from the T. reesei genome. B) Score of XYR1-binding sites at the 22 cellulase promoters. C) Distribution of CRE1-bindind sites scores at the genome scale. D) Scores of CRE1-bindind sites found at the 18 promoters from the glucose dataset.

