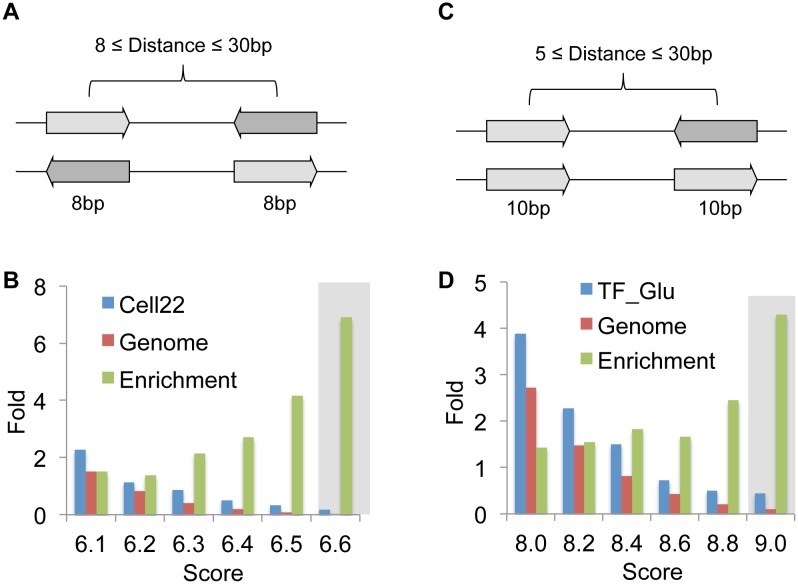
Figure 4. Search for repeated XYR1 and CRE1 binding sites on different datasets.
A) In the XYR1, both inverted and everted sites were considered and only sites within a distance between 8 and 30 bp were taken. B) Representation of repeated binding sites at the cellulase promoters and at the genome scale. The y-axis (fold) represents the number of sites identified relative to the number of promoters from the datasets. The enrichment group represents the rate between sites per promoters from the cellulase promoters and the corresponding valued from the genome group. Grey shaded region highlight the score with higher enrichment. C) For the prediction of CRE1-binding sites, both inverted and direct repeats spaced between 5 to 30 bp were considered. D) Representation of sites per promoters and the enrichment at the glucose dataset vs. the genome, calculated as in B.

