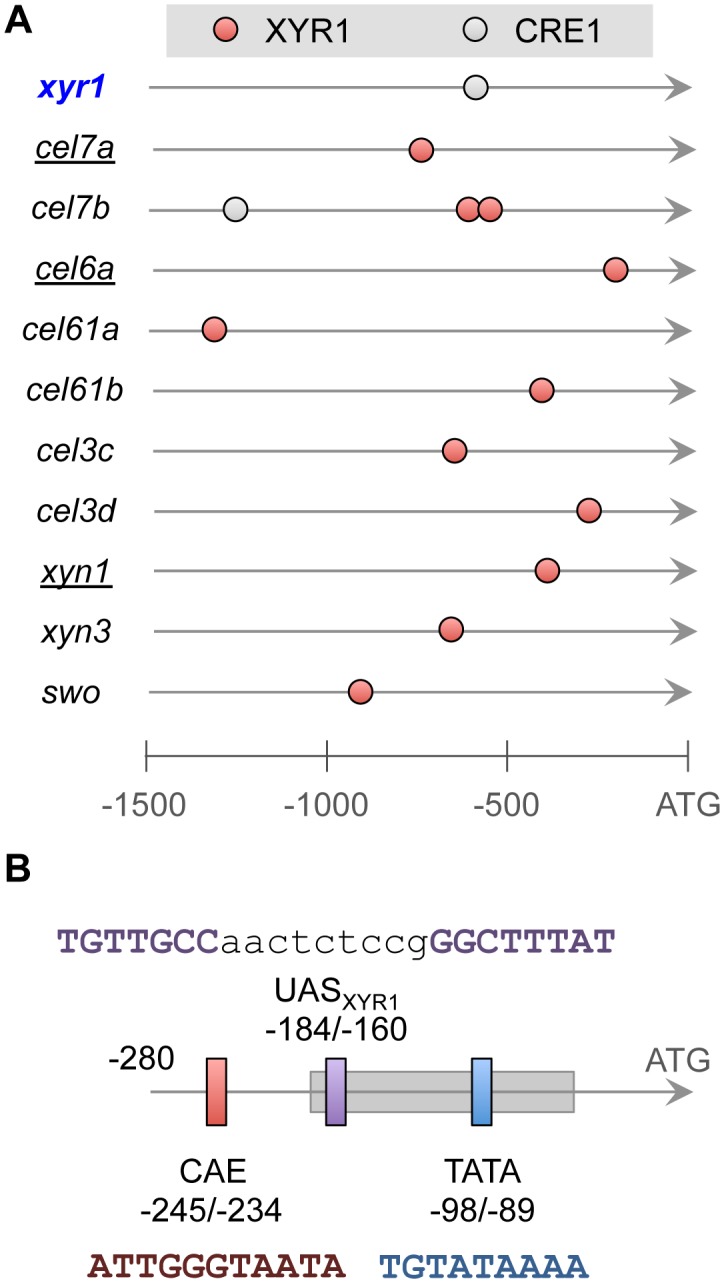
Figure 5. Identification of XYR1 and CRE1-binding sites at target promoters.

A) Representation of the binding sites found at the promoters of 10 cellulase encoding-genes and at promoters of the xyr1 gene. Each circle represent a binding site formed by repeats of the core sequences recognized by the two regulators. B) Zoom in at the promoter region of cel6a gene, showing the CAE (vertical red bar), the TATA-box (vertical blue bar), the nucleosome −1 binding region (horizontal grey rectangle) and the nearly identified binding site for XYR1, labelled as UASXYR1. The DNA sequences of each regulatory element are shown [26]. Shown positions are relative to the start codon (ATG) of the cel6a gene.
