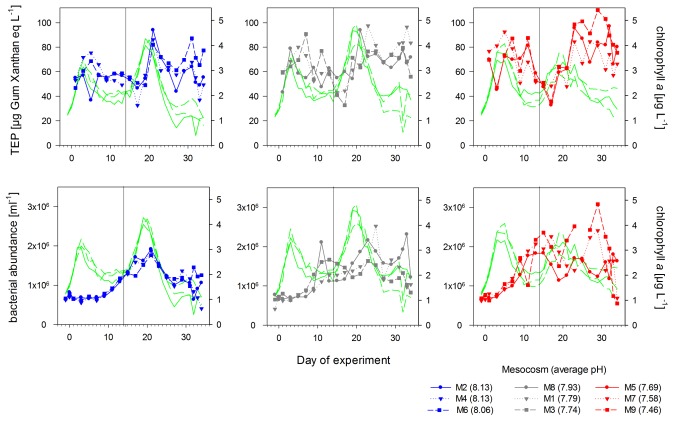
Figure 2. Transparent exopolymer particles and bacterial abundances.
Temporal development of transparent exopolymer particles (TEP) concentrations and free-living bacterial abundances in the high (blue), intermediate (grey) and low (red) pH treatments during the course of the experiment. Green lines indicate chlorophyll a concentrations in the corresponding mesocosms. Numbers in brackets give the mean pH value of each treatment over time. Vertical black line indicates the day of nutrient addition.

