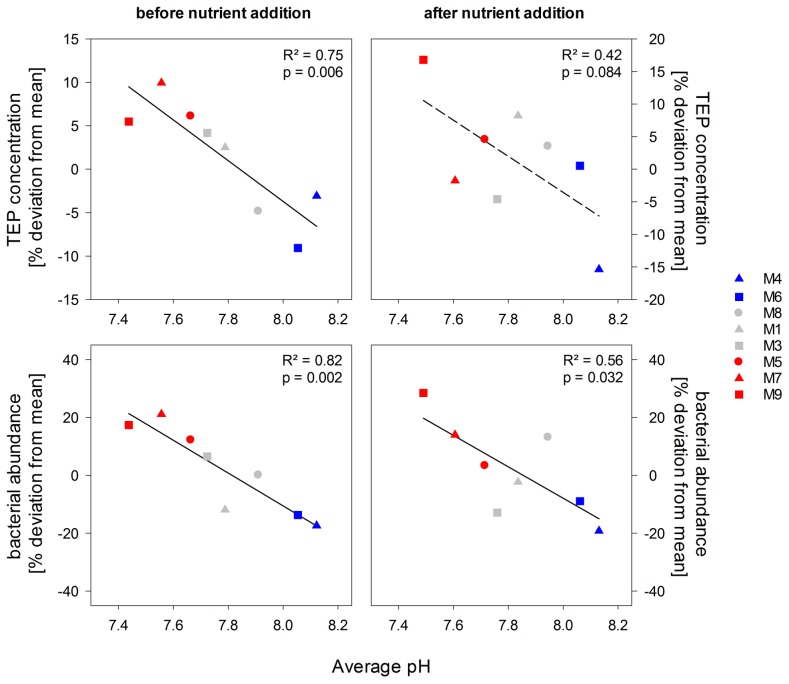
Figure 3. TEP concentrations and bacterial abundances as a function of treatment pH.
Symbols indicate the percentage deviation from the mean of all mesocosms over time of TEP and bacterial abundances in the high (blue), intermediate (grey) and low (red) pH mesocosms before and after nutrient addition. Dashed line indicates a non-significant relationship.

