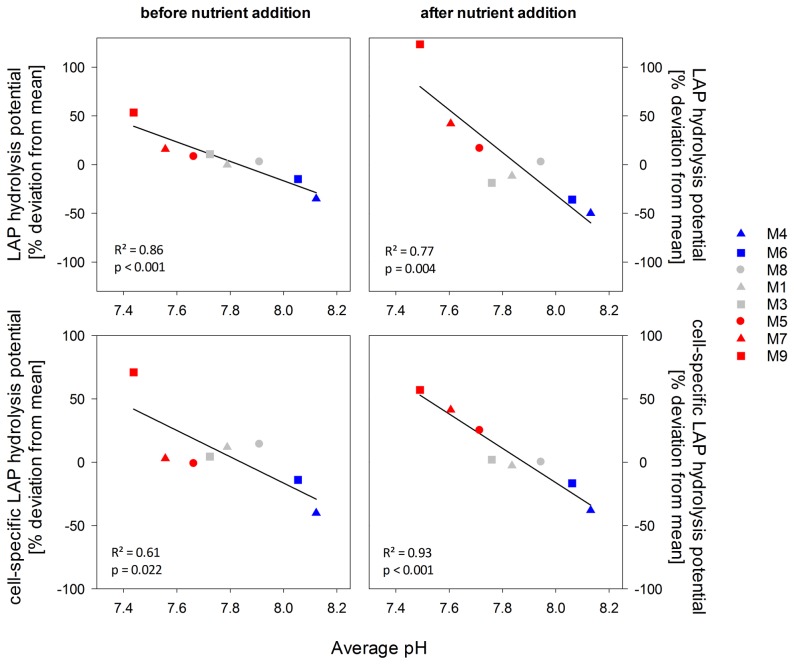
Figure 4. Leucine aminopeptidase (LAP) hydrolysis potential as a function of treatment pH.
Symbols indicate the percentage deviation from the mean of all mesocosms over time of total and cell-specific LAP hydrolysis potential in the period before and after nutrient addition in relation to the average pH value. Colors indicate high (blue), intermediate (grey) and low (red) pH treatments.

