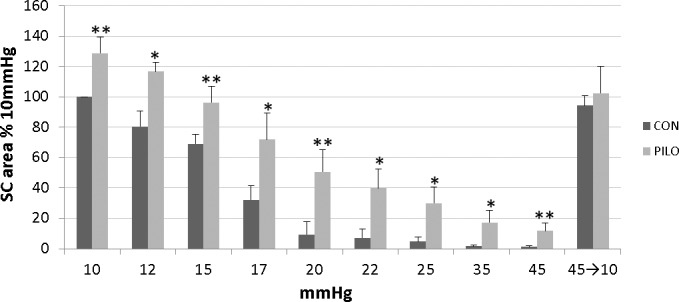
Figure 4.

Quantitative analysis of SC lumen dimensions of mice exposed to different levels of IOP in the absence (CON) or presence of pilocarpine (PILO). Bar graph shows cumulative results obtained from OCT images of four to five total mice (mean ± SD), analyzing SC lumen area at each different condition. Schlemm's canal lumen area of each averaged OCT image was analyzed using ImageJ software on two separate occasions and two measurements were averaged for each condition. Data shown are normalized to initial SC area at 10 mm Hg. Significant differences between untreated and pilocarpine-treated images are indicated (*P < 0.05, **P < 0.01).
