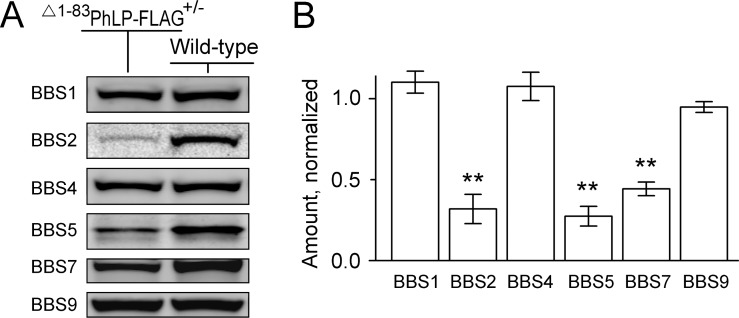
Figure 5.
Reduced levels of BBS proteins in the CCT-deficient rods. (A) A representative Western blot showing the levels of indicated BBS proteins in the whole-retina extracts of wild-type and Δ1–83PhLP-FLAG± littermates at P10. (B) The fluorescence value of each specific band of a Δ1–83PhLP-FLAG± mouse was normalized to that in a wild-type mouse, SEM, n = 4, P < 0.01 as determined by paired t-test (**).

