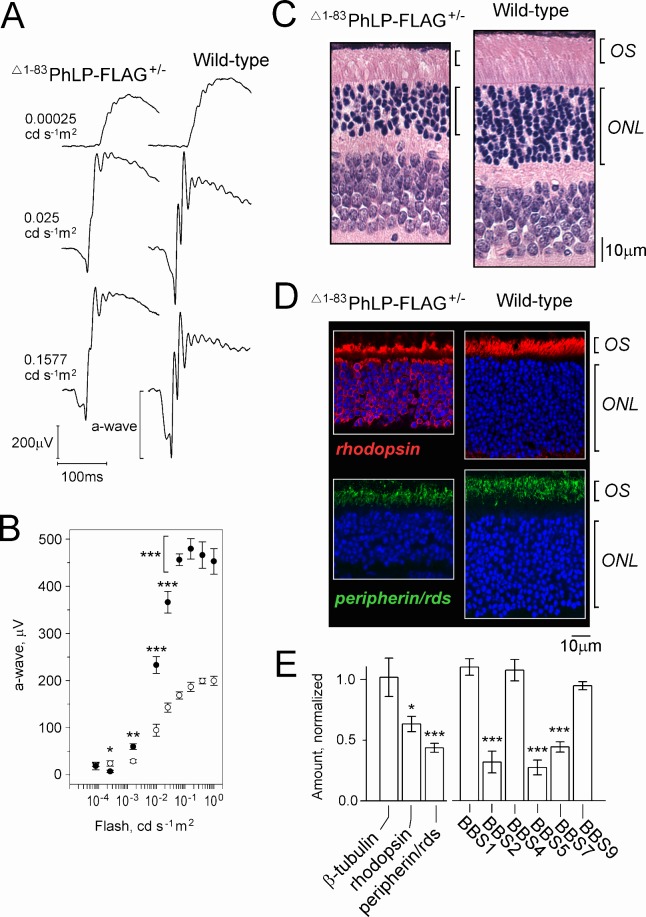
Figure 8.
Characterization of visual function, photoreceptor morphology, and protein expression in 21-day-old mice from transgenic line 1. (A) Representative ERG responses to 0.00025, 0.025, and 0.1577 cd s−1 m2 flashes (−40, −20, and −12 dB). (B) The a-wave amplitude as a function of flash intensity in Δ1–83PhLP-FLAG± (white circles) and wild-type (black circles); SEM, n = 6, P < 0.05 (*), P < 0.01 (**), P < 0.001 (***) as determined by t-test. (C) Paraffin-embedded retina cross-sections were stained with hematoxylin and eosin to visualize their cellular composition. (D) Subcellular localization of rhodopsin (red) and peripherin/rds (green) as determined by immunofluorescence microscopy. Cell nuclei are stained with DAPI. (E) Levels of the indicated proteins determined by Western blotting of whole retina extracts of Δ1–83PhLP-FLAG± mice were normalized to the corresponding values of wild-type mice. Error bars represent SEM, n = 3 (rhodopsin), n = 6 (peripherin/rds), n = 4 (BBS), P < 0.05 (*), P < 0.01 (**), and P < 0.001 (***) as determined by paired t-test.

