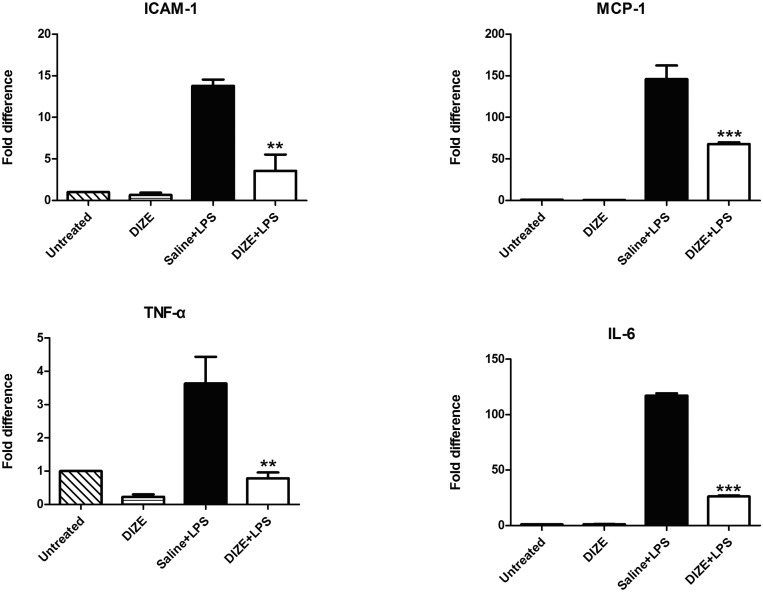
Figure 6.
Real-time RT-PCR analysis of mRNA expression for inflammatory cytokines. The whole eyecups were used for analyzing the mRNA levels of the inflammatory cytokines: ICAM-1, MCP-1, TNF-α, and IL-6. Values on the y-axis represent the fold changes at 24 hours after LPS injection. All values were normalized to the untreated control. **P < 0.01, ***P < 0.001 (n = 4, versus saline + LPS group).

