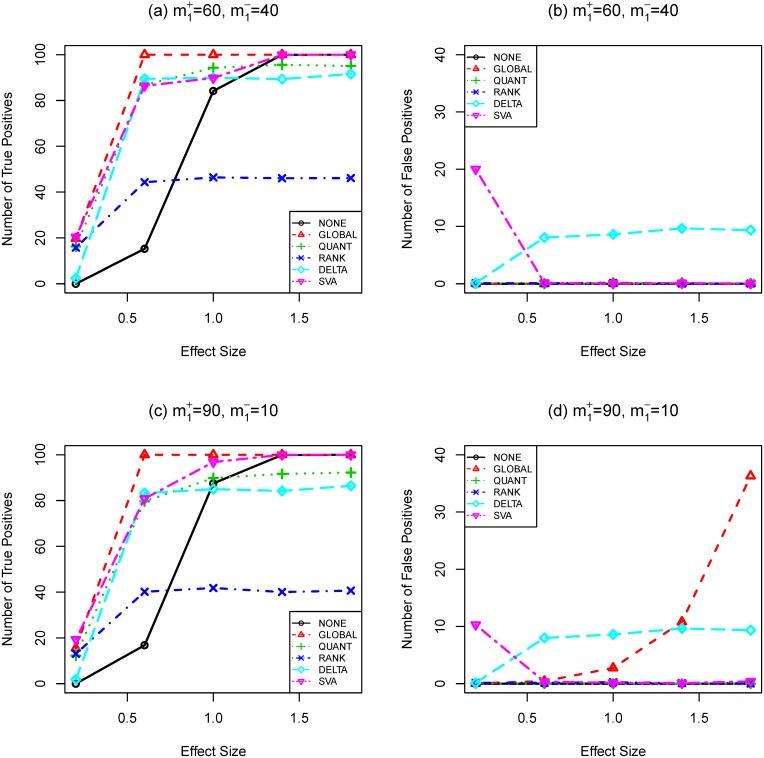
Figure 1. Number of true (a,c) and false (b,d) positives as functions of effect size (SIMU1).
Total number of genes is  . Total number of truly differentially expressed genes is
  , where
  and
and  are the numbers of up- and down-regulated genes, respectively. The sample size is
  . t-test and Bonferroni procedure are applied. Adjusted
  -value threshold: 0.05.

