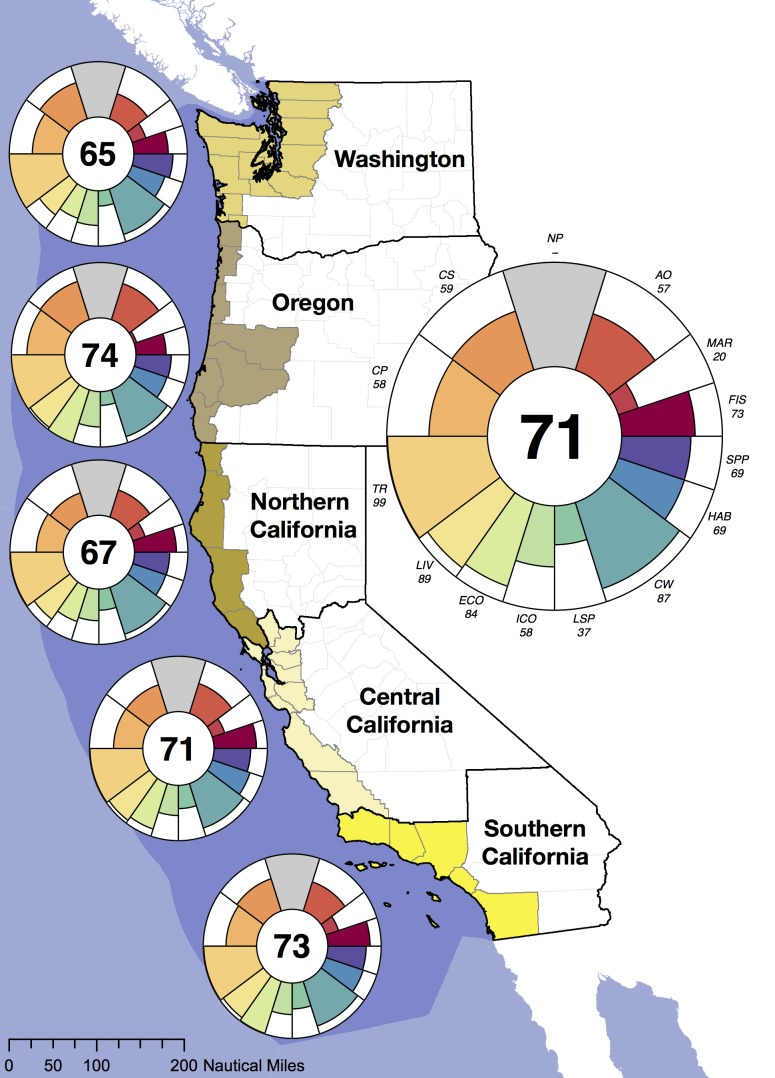
Figure 2. Map of the study region with each goal score per sub-region (left) and for the overall U.S. west coast (right).
Each petal in the plots represents the score (radius) and weight (width) for the goal or sub-goal; see Fig. 1 for color legend and goal names. The number in the center is the overall Index score. Natural products is not assessed. Regions are depicted with coastal counties and the 200 nm exclusive economic zone is shaded in darker blue for reference only; regional scores are the area-weighted average of sub-region scores.

