
Figure 1. A The body weight comparison between Toxo+ and Toxo− group.
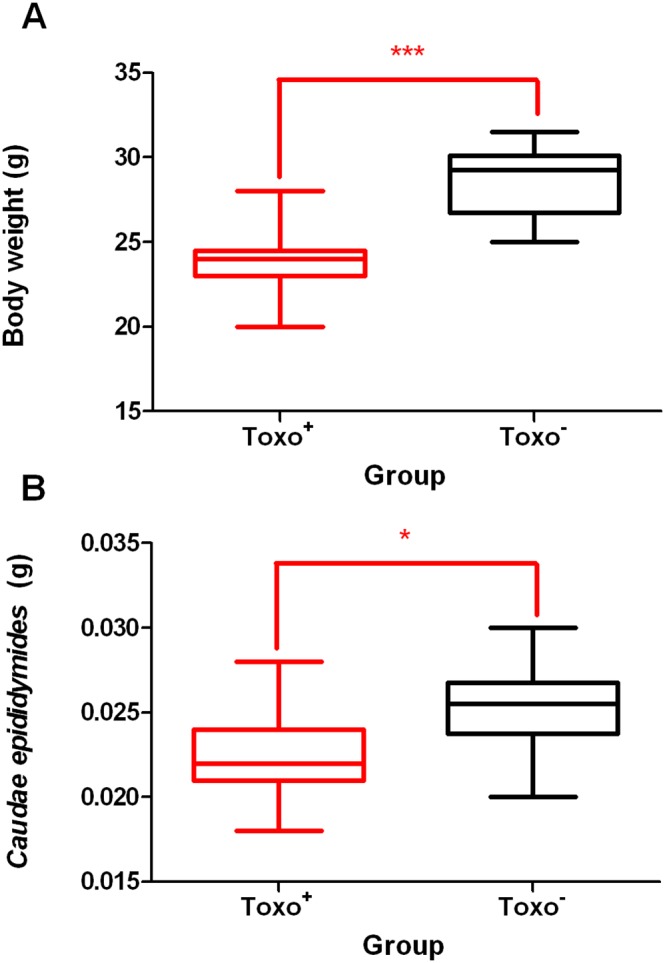
The middle line indicates the arithmetic mean, the box extends from the 25th to 75th percentiles and the whiskers indicate the minimum and maximum of the measurement. (***p≤0.001). B The caudae epididymidae weight comparison between Toxo+ and Toxo− group. The middle line indicates the arithmetic mean, the box extends from the 25th to 75th percentiles and the whiskers indicate the minimum and maximum of the measurement. (*p value≤0.05).