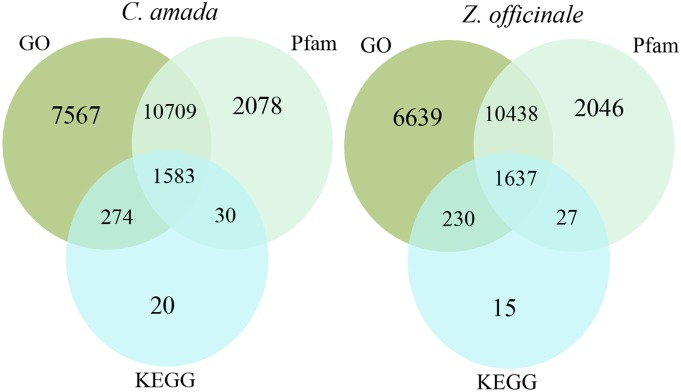
Figure 2. Distribution of similarity search results showed by Venn diagrams.

The number of unique sequence-based annotations is the sum of unique best BLASTX hits from the GO term, Pfam domains and KEGG databases, respectively. The overlap regions among the three circles contain the number of unigenes that share BLASTX similarity with respective databases.
