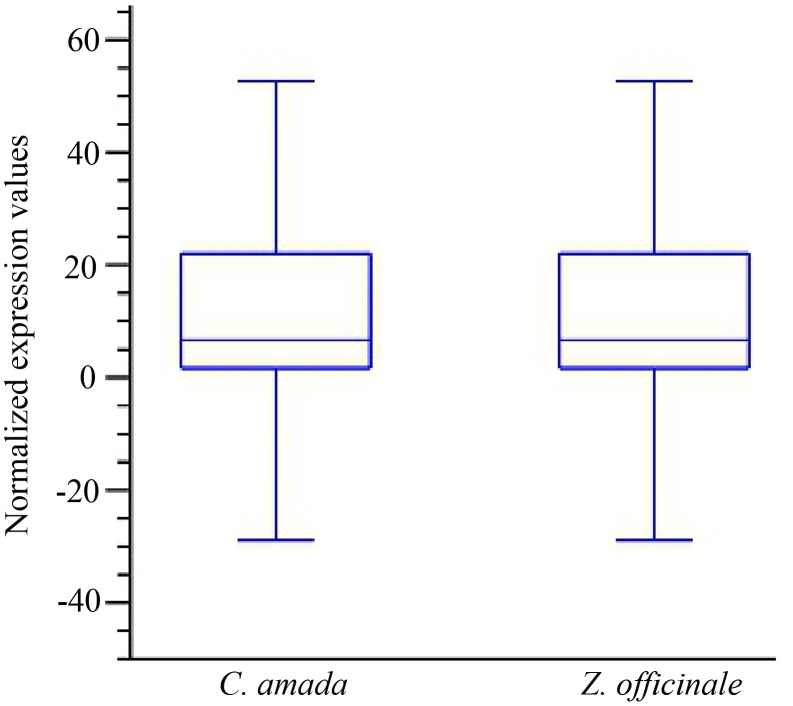
Figure 4. Box plot analysis of read mapping data after quantile normalization in C. amada and Z. officinale transcriptome.
The transcript expression values (RPKM) overall distribution and variability of two cDNA libraries/samples were similar, indicating that they were comparable for identification of differentially expressed genes (DEGs) at the transcriptome level.

